Scheduled Downtime
On Friday 21 April 2023 @ 5pm MT, this website will be down for maintenance and expected to return online the morning of 24 April 2023 at the latest

ASTER not localizing

This post was from a previous version of the WRF&MPAS-A Support Forum. New replies have been disabled and if you have follow up questions related to this post, then please start a new thread from the forum home page.

kaelel18

Member
Hi everyone. I am a new WRF user and I would like to ask for your help. I am simulating wind flow over complex terrain and have configure 3 domains where the 3rd domain requires higher resolution than what WPS has. I downloaded ASTER with 3s resolution. Here are the steps I did.

I downloaded the ASTER file and converted it to a binary file using gdal. Here's the gdalinfo for the tif file.

Code:
Driver: GTiff/GeoTIFF
Files: data.tif
Size is 9571, 11865
Coordinate System is:
GEOGCS["WGS 84",
    DATUM["WGS_1984",
        SPHEROID["WGS 84",6378137,298.257223563,
            AUTHORITY["EPSG","7030"]],
        AUTHORITY["EPSG","6326"]],
    PRIMEM["Greenwich",0],
    UNIT["degree",0.0174532925199433],
    AUTHORITY["EPSG","4326"]]
Origin = (119.608194444411112,16.852638888888887)
Pixel Size = (0.000277777777778,-0.000277777777778)
Metadata:
  AREA_OR_POINT=Area
  TIFFTAG_DOCUMENTNAME=created at
  TIFFTAG_IMAGEDESCRIPTION=SILC TIFF
  TIFFTAG_RESOLUTIONUNIT=2 (pixels/inch)
  TIFFTAG_SOFTWARE=IDL 7.1.1, ITT Visual Information Solutions
  TIFFTAG_XRESOLUTION=100
  TIFFTAG_YRESOLUTION=100
Image Structure Metadata:
  INTERLEAVE=BAND
Corner Coordinates:
Upper Left  ( 119.6081944,  16.8526389) (119d36'29.50"E, 16d51' 9.50"N)
Lower Left  ( 119.6081944,  13.5568056) (119d36'29.50"E, 13d33'24.50"N)
Upper Right ( 122.2668056,  16.8526389) (122d16' 0.50"E, 16d51' 9.50"N)
Lower Right ( 122.2668056,  13.5568056) (122d16' 0.50"E, 13d33'24.50"N)
Center      ( 120.9375000,  15.2047222) (120d56'15.00"E, 15d12'17.00"N)
Band 1 Block=9571x1 Type=Int16, ColorInterp=Gray
  NoData Value=-32768

I created an index and stored it in the geog file as topo_ASTER. Below is the index and tbl.

Code:
type = continuous
signed = yes
projection = regular_ll
dx = 0.0002777777777779997
dy = 0.0002777777777779997
known_x = 1.0
known_y = 1.0
known_lat = 13.557083333330699
known_lon = 119.60819444441111
wordsize = 2
endian = big
tile_x = 9571
tile_y = 11865
tile_z = 1
row_order = bottom_top
missing_value = -32768
units = "meters MSL"
description = "ASTER 1-sec Topography Height"

Code:
name = HGT_M
        priority = 1
        dest_type = continuous
        smooth_option = smth-desmth_special; smooth_passes=1
        fill_missing=0.
        interp_option =     ASTER:average_gcell(4.0)+four_pt+average_4pt
        interp_option =     gtopo_30s:average_gcell(4.0)+four_pt+average_4pt
        interp_option =     gtopo_2m:four_pt
        interp_option =     gtopo_5m:four_pt
        interp_option =     gtopo_10m:four_pt
        interp_option =     default:average_gcell(4.0)+four_pt+average_4pt
        rel_path =          ASTER:topo_ASTER/
        rel_path =          gtopo_30s:topo_30s/
        rel_path =          gtopo_2m:topo_2m/
        rel_path =          gtopo_5m:topo_5m/
        rel_path =          gtopo_10m:topo_10m/
        rel_path =          default:topo_gmted2010_30s/

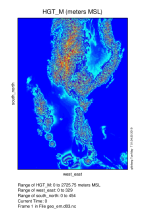
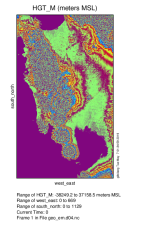
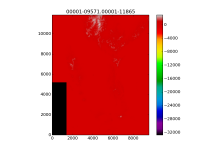
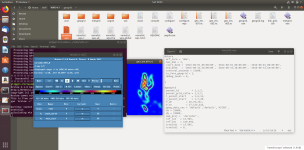
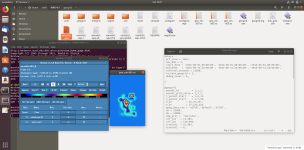
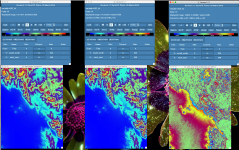
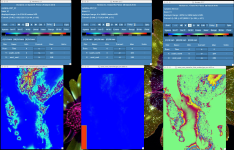
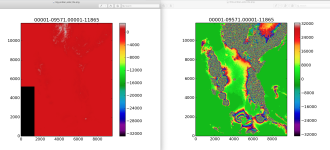
When I run geogrid.exe, everything went fine. But the problem was, when I tried getting the minmax of my domain which uses ASTER, i get a value of 0. I tried checking it also with panoply, but my third domain doesnt have any values. What seems to be the problem? Thank you so much. By the way, I am using WRF3.9. The namelist.wps is seen below.


Code:
&share
 wrf_core = 'ARW',
 max_dom = 3,
 start_date = '2016-08-01_00:00:00', '2016-08-01_00:00:00', '2016-08-01_00:00:00', 
 end_date   = '2016-08-31_18:00:00', '2016-08-31_18:00:00', '2016-08-31_18:00:00', 
 interval_seconds = 21600,
 io_form_geogrid = 2,
 opt_output_from_geogrid_path = '/home/gilbilang/WRF/WPS_Output/Bataan2/',
 debug_level = 0,
/

&geogrid
 parent_id         = 1,1,2,
 parent_grid_ratio = 1,5,5,
 i_parent_start    = 1,6,13,
 j_parent_start    = 1,7,20,
 e_we          = 26,76,251,
 e_sn          = 37,126,326,
 geog_data_res = '5m','2m','ASTER',
 dx = 10000,
 dy = 10000,
 map_proj =  'mercator',
 ref_lat   = 15.985,
 ref_lon   = 120.992,
 truelat1  = 15.985,
 truelat2  = 0,
 stand_lon = 120.992,
 geog_data_path = '/home/gilbilang/WRF/WPS_GEOG/',
 opt_geogrid_tbl_path = '/home/gilbilang/WRF/WPS/geogrid/',
 ref_x = 13.0,
 ref_y = 18.5,
/

&ungrib
 out_format = 'WPS',
 prefix = 'FILE',
/

&metgrid
 fg_name = 'FILE',
 io_form_metgrid = 2,
 opt_output_from_metgrid_path = '/home/gilbilang/WRF/WPS_Output/Bataan/',
 opt_metgrid_tbl_path = '/home/gilbilang/WRF/WPS_Output/Bataan/',
/

&mod_levs
 press_pa = 201300 , 200100 , 100000 ,
             95000 ,  90000 ,
             85000 ,  80000 ,
             75000 ,  70000 ,
             65000 ,  60000 ,
             55000 ,  50000 ,
             45000 ,  40000 ,
             35000 ,  30000 ,
             25000 ,  20000 ,
             15000 ,  10000 ,
              5000 ,   1000
 /


&domain_wizard
 grib_data_path = '/home/gilbilang/WRF/Data/FNL/August',
 grib_vtable = 'Vtable.GFS',
 dwiz_name    =Bataan
 dwiz_desc    =
 dwiz_user_rect_x1 =13431
 dwiz_user_rect_y1 =3200
 dwiz_user_rect_x2 =13662
 dwiz_user_rect_y2 =3462
 dwiz_show_political =true
 dwiz_center_over_gmt =true
 dwiz_latlon_space_in_deg =10
 dwiz_latlon_linecolor =-8355712
 dwiz_map_scale_pct =100.0
 dwiz_map_vert_scrollbar_pos =3047
 dwiz_map_horiz_scrollbar_pos =12900
 dwiz_gridpt_dist_km =25.0
 dwiz_mpi_command =mpirun
 dwiz_tcvitals =null
 dwiz_bigmap =Y
/
 
Hi,
1) I assume that you stored the topo_ASTER directory inside your /home/gilbilang/WRF/WPS_GEOG/ directory?
2) On the post, you said that you are using 3s resolution data, but in the index file, it seems to be looking for 1s data (which I assume is accurate). Just want to make sure there aren't any discrepancies with the resolution you're expecting and using.
2) I'm going to attach a python script that can plot one of your topographic tiles. Can you try to run this for a few of your files and make sure that the data look as expected? To use this script, you'll need to make sure you have python, numpy, and matplotlib installed, and then run with the following syntax:
Code:
python plot_tile.py path_to_tile/tile
This will create a *.png file that you can then view. Make sure that the image looks like what you would expect, and that it's not upside down or mirrored from what it should be.

Kelly
 

Attachments

  • plot_tile.py
    923 bytes · Views: 86
Hi. I am sorry for the late reply. To answer your questions,

1.) Yes, it is in the GEOG directory.
2.) I'm sorry. Yes, it is 1s resolution.

3.) I tried the script you gave, but all I getting is an error.

I used this script where data is taken from the index file, which,

Code:
import numpy as np
import sys
import matplotlib.pyplot as plt

"""
 These settings come directly from the index file for the dataset
"""
tile_x = 9571
tile_y = 11865
tile_bdr = 3
scaleFactor = 1.0
wordsize = 2

if len(sys.argv) != 2:
	print('Usage: '+sys.argv[0]+' <tile name>')
	sys.exit(1)

"""
 If the data are in little-endian byte order, change '>' to '<' below and
 add endian=little to the index file
"""
stype = '>i'+repr(wordsize)
dt = np.dtype(stype)
arr = np.fromfile(sys.argv[1], dtype=dt)

tilex = tile_x + 2*tile_bdr
tiley = tile_y + 2*tile_bdr

if len(arr) != (tilex * tiley):
	print('Error: tile does not have the expected number of elements')
	sys.exit(1)

arr = arr * scaleFactor
tile = np.reshape(arr, (tiley, tilex))

plt.imshow(tile[:,:], cmap='spectral', interpolation='nearest', origin='lower')
plt.colorbar()
plt.title(sys.argv[1])
filename = sys.argv[1]+'.png'
plt.savefig(filename,dpi=150)
plt.clf()

the index file is,

Code:
ype = continuous
signed = yes
projection = regular_ll
dx = 0.0002777777777779997
dy = 0.0002777777777779997
known_x = 1.0
known_y = 1.0
known_lat = 13.557083333330699
known_lon = 119.60819444441111
wordsize = 2
endian = big
tile_x = 9571
tile_y = 11865
tile_z = 1
row_order = bottom_top
missing_value = -32768
units = "meters MSL"
description = "ASTER 1-sec Topography Height"

When I tried running the code, is results to this,

Code:
Error: tile does not have the expected number of elements

I traced the possible error for this. I dont know if it has something to do with tile_x and tile_y not the same. Thanks for the help.
 
Hi,
Can you attach one of your binary files (converted for the use with geogrid) so that I can do a test?

Thanks,
Kelly
 
Hello,

Please try these changes in your index file:

known_y = 11865
endian = little
row_order = top_bottom

Or, depending on how your data is organized within binary file, different combinations of those. Something there is most probably cause of why you're not getting topography in domain.

Ivan
 
Hi. I did some runs using the index below

Code:
type = continuous
signed = yes
projection = regular_ll
dx = 0.0002777777777779997
dy = 0.0002777777777779997
known_x = 1.0
known_y = 1.0
known_lat = 13.557083333330699
known_lon = 119.60819444441111
wordsize = 2
endian = little
tile_x = 9571
tile_y = 11865
tile_z = 1
row_order = bottom_top
missing_value = -32768
units = "meters MSL"
description = "ASTER 1-sec Topography Height"

apparently, the height values for ASTER seems to be way off compared to that of the WPS geog of 30s . The 30s resolution has a range value of (0, 2725.25 meters) which seems reasonable, while for ASTER is (-38,249.2, 37,1585.5 meters). Below are the two pictures one with wps resolution (d03.nc) and the other is aster (d04.nc). What do you think?
 

Attachments

  • d03.PNG
    d03.PNG
    115.8 KB · Views: 4,079
  • d04.PNG
    d04.PNG
    157.8 KB · Views: 4,079
Hi,
Thank you for sending that. I was able to get that to plot with the script I sent, but tile_bdr needed to be changed to 0. I'll attach the plot of that, just for your reference.

I also was able to get everything to work, using the static data file that you sent, along with your namelist.wps and your index file. I placed the topography file & index file in a directory different than that with all my other static data, so instead of 'rel_path' in the GEOGRID.TBL, I used 'abs_path' with the path to the data. I just modified the GEOGRID.TBL that is found in WPS/geogrid/. I had to remove some of your specific paths in the namelist so that it would work on my machine, but other than that, I kept everything the same. I ran a test with the Aster data and without. Using ncview I was able to see the higher-resolution data on d03. The only thing I can think of that may be going on with your run is that this line in your namelist may not be pointing to the correctly-modified GEOGRID.TBL?
Code:
opt_geogrid_tbl_path = '/home/gilbilang/WRF/WPS/geogrid/',

I am not seeing the large discrepancy in min/max values that you are seeing with default static data vs. Aster data. I'm attaching a screenshot showing the comparison of d03 with/without Aster data (with is on the left, and default topography is shown on the right). I'm not sure what exactly you are plotting, but at least the low value you are seeing for Aster data (-38249.2) could be due to the missing section of data in the lower left corner of the tile plot (see the 00001*.png file).

In case it helps at all, I'm also attaching the namelist.wps file I used, along with the GEOGRID.TBL I used.


Kelly
 

Attachments

  • 00001-09571.00001-11865.png
    00001-09571.00001-11865.png
    129.2 KB · Views: 4,080
  • GEOGRID.TBL
    17.5 KB · Views: 60
  • d03_aster_vs_default.png
    d03_aster_vs_default.png
    555.3 KB · Views: 4,080
  • namelist.wps
    1.8 KB · Views: 60
Hi, thank you for your assistance. A quick question though when you said that you're seeing no large discrepancy between my min/max values. Does this mean that the transition from default (d02) to ASTER (d03) having hgt values of (0, 2725.25 meters) and (-38,249.2, 37,158.5 meters), respectively, is expected? I do understand the -38,249.2 part, but the big jump from 2725.25m to 37158.5m is that expected?

Also, i tried running your attached namelist and configured the geogrid.tbl following your suggestion. I ran geogrid and used ncview, but the results arent the as same yours. I don't know where it went wrong. Again thank you for your time in answering my questions.

Screenshot from 2019-05-07 12-26-26.png
 
Hi,
When I said that I didn't see the large discrepancy, I meant with my run. Do you have several Aster files inside your WPS_GEOG/topo_ASTER/ directory, or just the 1 file that you gave me?
 
Thanks for the clarification. I only have one file, the one I gave you. On another note, one thing I notice though is that even with the same namelist, the range of hgt for my domain 2 isnt the same as yours.
 
I'm not sure why that is happening. Can you send me the GEOGRID.TBL file that is in /home/gilbilang/WRF/WPS/geogrid/?
 
Thanks for sending that. Everything looks okay with your GEOGRID.TBL. This is honestly a mystery to me how you are getting such different values when using the same files I am. At this point, I would recommend this:

1) Rebuild WPS (use the latest version v4.1) in an entirely new/clean directory (so that you can save your original one). Don't make any modifications to the code. Just build it as-is.

2) Set up a very basic run (perhaps only 1 domain), and set the resolution high and make the domain fairly large (several hundred X several hundred), and set geog_data_res to use ASTER data for this domain. Make sure you put the modified GEOGRID.TBL in the correct place. If possible, don't ask that your geo_em file be output anywhere else - just have it output to the WPS/ running directory so that when you use ncview to look at that file, you know that you are looking at the correct run.

3) Save that output, and then run the same case, but set geog_data_res = 'default' instead. Then compare the 2 outputs.

Let me know the result of that test. Thanks!
 
Hi kwener. Apologies for the late response. Had been preoccupied with other important stuff as well. Anyhow, I followed your instruction. I actually set-up a new vmbox and installed a new WPS-4.1 and WRF just to be sure. Using the same geog files from my previous set-up, I ran the d01 using default and aster. I still got the same erroneous values though. I tried looking out for possible errors regarding this configuration, but to no avail.
 

Attachments

  • d01-aster.png
    d01-aster.png
    296.4 KB · Views: 4,027
  • D01-default.png
    D01-default.png
    270.7 KB · Views: 4,026
Hi,
Thank you for running that test. Okay, so I somehow missed that you said a while back that you had switched to 'little' endian in your index file. I tried that and NOW I am seeing the same things that you are. So these are the results I'm seeing:

1) When I use the original namelist you provided (dx = 10000), with ASTER data only turned on for d03 ( geog_data_res = 'default','default','ASTER' ), and I use the index file with endian = big, and only use ASTER data for d03, I am seeing reasonable results for d03 with aster, compared to without.
2) Using that same namelist (as in 1), but using an index file with endian = little, I see the large discrepancy in heights that you saw.
3) When using the new namelist you are using (dx = 25000), with ASTER data only turned on for d03 ( geog_data_res = 'default','default','ASTER' ), and using index file with endian = big, I get unreasonable values, with barely anything shown in the HGT_M image (which is oddly similar to the plot of the aster data file that I attached in a previous post).
4) When using the same namelist, as in 3), with ASTER data only turned on for d03 ( geog_data_res = 'default','default','ASTER' ), and using index file with endian = little, I again get odd values.

5) When I plot your Aster tile as big endian, I get the weird (missing info) tile. When I plot the tile assuming it's little endian, it looks more like the landscape, but looks similar to the bad values you are seeing (similar to my run 2).

So my conclusions are:
1) You need to determine for sure whether these data are little or big endian because it clearly makes a difference.
2) If it's determined that it should be big endian, then it seems that there may be areas in the domain that are out of bounds (specifically for d03 when using a resolution of 25k, and for even d01 when using either resolution). If you need to cover more area, you may need to reprocess the aster data to incorporate more land cover. It's likely that you only need to use Aster data for d03, and if that's the case, if you are interested in using the dx=10000 namelist, then this set-up may be okay.
3) If it's determined that it should be little endian, then it seems that something may be wrong with your tile, or the data, as the values are very bad.
4) I don't think this is related to this problem at all, but we do not recommend having any domain smaller than 100x100, so you may want to reconfigure your domain size for d01 so that this domain is larger. If that's the case, again, you may need more Aster data to cover the land you are interested in.

I'm attaching screenshots to show you my various run comparisons. One is using your 10k resolution namelist, and the other is for the 25k resolution namelist. I'm also attaching screenshots showing the comparison of the Aster tile with big vs. little endian.
 

Attachments

  • original_namelist.png
    original_namelist.png
    2.3 MB · Views: 4,016
  • new_namelist.png
    new_namelist.png
    1.7 MB · Views: 4,016
  • big_vs_little_endian_aster_tile.png
    big_vs_little_endian_aster_tile.png
    1 MB · Views: 4,018
Hi. Apologies for the late response as I was preoccupied with some stuff. Anyway, thanks for this. I'll give you an update if this works
 
Top