HI~
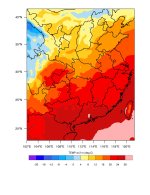
I am dong a simulation in China from 2017.10.21 to 2017.10.27 , the results show that the average temperature at 2 m near the coastline is seriously underestimated ( picture 1 attched below,the east coast around China and other regions are dramatically decreased ),and it should be around 15 ~ 20 degree C in normal circumstances.
For comparsion , I do the simulation at the same time from 2016.10.21 to 2016.10.27, and the reslult is much more reasonable ( picture 2 attached below ), and I dont know where the problem is , Is it due to the difference in weather conditions?
I use the same namelist.input file in the two simulations except for the simulation year, and my namelist.input is attached below.
Could someone help me to find the reason?