*************************************************
Dear Colleagues,
I have three domains for my research area, and I have two questions related to rainfall plots:
1. When I plot time series, contour and other plot types for it, which domain I need to use? What are the differences of the plots for domain 1, 2 and 3?
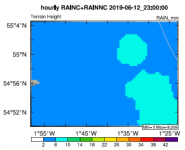
2. When I use domain 3 wrfout file to plot rainfall, the longitude and latitude seem not in the centre of my plot (ref_lat = 54.990311, ref_lon = -1.629891,). Could you please kindly point out my issues? I add the ncl code and figure below.
Looking forward to hearing from you soon. Many thanks.
Best wishes,
Stella
*************************************************
;----------------------------------------------------------------------
; WRF_pcp_2.ncl
;
; Concepts illustrated:
; - Plotting WRF data
; - Overlaying WRF precipitation on terrain map using gsn_csm functions
; - Setting the correct WRF map projection using wrf_map_resources
; - Creating two contour plots with two sets of filled contours
; - Explicitly setting contour levels
; - Drawing fully transparent filled contours
; - Turning the tickmarks inward on the X and Y axes
; - Moving the contour informational label into the plot
; - Customizing the contour informational label
;----------------------------------------------------------------------
; This script shows how to plot WRF rain totals on a WRF terrain map,
; using transparency for all rain totals below a certain level.
;----------------------------------------------------------------------
; This script was contributed by Xiao-Ming Hu (xhu@ou.edu)
; Center for Analysis and Prediction of Storms
; University of Oklahoma
;----------------------------------------------------------------------
; These files are loaded by default in NCL V6.2.0 and newer
; load "$NCARG_ROOT/lib/ncarg/nclscripts/csm/gsn_code.ncl"
; load "$NCARG_ROOT/lib/ncarg/nclscripts/csm/gsn_csm.ncl"
; load "$NCARG_ROOT/lib/ncarg/nclscripts/wrf/WRFUserARW.ncl"
begin
idomain = 3 ; 3,3
;---Rain data
f0 = addfile("wrfout_d03_2019-06-11_00:00:00.nc","r")
Times = f0->Times
dims = dimsizes(Times)
RAINC = f0->RAINC(0,:,")
RAINNC = f0->RAINNC(0,:,
RainTotal = RAINC,
;---Terrain data
fmap = addfile("wrfout_d03_2019-06-11_00:00:00.nc","r")
HGT = fmap->HGT(0,:,
HGT =(/HGT/1000./)
;---Start the graphics
wks = gsn_open_wks("pdf" ,"WRF_pcp")
;---Set resources for terrain plot
res_ter = True ; plot mods desired
res_ter@gsnFrame = False
res_ter@gsnDraw = False
res_ter@cnFillOn = True ; color plot desired
res_ter@cnFillPalette = "gsltod" ; Select grayscale colormap
res_ter@cnLinesOn = False ; turn off contour lines
res_ter@cnLineLabelsOn = False ; turn off contour labels
res_ter@cnFillMode = "RasterFill"
res_ter@cnFillOpacityF = 1.
res_ter@lbLabelBarOn = False
res_ter@gsnRightString = ""
res_ter = wrf_map_resources(fmap, res_ter) ; set map resources to match those on WRF file
res_ter@tfDoNDCOverlay = True
res_ter@mpOutlineBoundarySets = "AllBoundaries"
res_ter@mpDataSetName = "Earth..4" ; Gives us provincial boundaries
res_ter@mpGeophysicalLineThicknessF = 1.5 ; thickness of map outlines
res_ter@mpProvincialLineThicknessF = 2.
res_ter@mpProvincialLineColor = "black"
res_ter@pmTickMarkDisplayMode = "Always" ; turn on nicer tickmarks
res_ter@tmXBLabelFontHeightF = 0.018
res_ter@tmYLLabelFontHeightF = 0.018
res_ter@tmYLLabelStride = 2 ; label every other tickmark
res_ter@tmXBLabelStride = 2
;---Point the tickmarks inward
res_ter@tmYRMajorOutwardLengthF = 0
res_ter@tmYLMajorOutwardLengthF = 0
res_ter@tmXBMajorOutwardLengthF = 0
res_ter@tmXBMinorOutwardLengthF = 0
res_ter@tmXTOn = True
res_ter@tmYROn = True
res_ter@tmYRLabelsOn = False
res_ter@tmXTLabelsOn = False
;---Set resources for rain total contour plot
res_tot = True
res_tot@gsnFrame = False
res_tot@gsnDraw = False
cmap := read_colormap_file("BlAqGrYeOrReVi200")
cmap(0, = (/0,0,0,0/) ; make first color fully transparent
res_tot@cnFillOn = True
res_tot@cnFillMode = "RasterFill"
res_tot@cnFillPalette = cmap
res_tot@cnLinesOn = False ; turn off contour lines
res_tot@cnLineLabelsOn = False ; turn off contour labels
res_tot@cnFillOpacityF = 1. ; .85
res_tot@tfDoNDCOverlay = True
res_tot@cnLevelSelectionMode = "ManualLevels"
res_tot@cnMaxLevelValF = 42
res_tot@cnMinLevelValF = 2
res_tot@cnLevelSpacingF = 4
res_tot@pmLabelBarHeightF = 0.08 ; Make labelbar less thick
res_tot@lbLabelFontHeightF = 0.014
res_tot@pmLabelBarOrthogonalPosF = -0.008
res_tot@cnInfoLabelOn = True
res_tot@cnInfoLabelString = "Min= $ZMN$ Max= $ZMX$"
res_tot@cnInfoLabelOrthogonalPosF = -0.104 ; move info label into plot
res_tot@tiMainFont = "Helvetica-bold"
res_tot@tiMainFontHeightF = 0.018
res_tot@gsnRightString = "RAIN, mm"
res_tot@gsnLeftString = ""
do ihour = 0, dims(0)-2
istart = ihour
iend = ihour+1
RainTotal = (/(f0->RAINC(iend,:, + f0->RAINNC(iend,:, - \
(f0->RAINC(istart,:, + f0->RAINNC(istart,:,))/1. /)
res_tot@tiMainString = "hourly RAINC+RAINNC " +chartostring(f0->Times(iend,)
plot_terrain = gsn_csm_contour_map(wks,HGT,res_ter)
plot_raintot = gsn_csm_contour(wks,RainTotal,res_tot)
overlay(plot_terrain, plot_raintot)
draw(plot_terrain)
frame(wks)
end do ; ihour
end
Dear Colleagues,
I have three domains for my research area, and I have two questions related to rainfall plots:
1. When I plot time series, contour and other plot types for it, which domain I need to use? What are the differences of the plots for domain 1, 2 and 3?
2. When I use domain 3 wrfout file to plot rainfall, the longitude and latitude seem not in the centre of my plot (ref_lat = 54.990311, ref_lon = -1.629891,). Could you please kindly point out my issues? I add the ncl code and figure below.
Looking forward to hearing from you soon. Many thanks.
Best wishes,
Stella
*************************************************
;----------------------------------------------------------------------
; WRF_pcp_2.ncl
;
; Concepts illustrated:
; - Plotting WRF data
; - Overlaying WRF precipitation on terrain map using gsn_csm functions
; - Setting the correct WRF map projection using wrf_map_resources
; - Creating two contour plots with two sets of filled contours
; - Explicitly setting contour levels
; - Drawing fully transparent filled contours
; - Turning the tickmarks inward on the X and Y axes
; - Moving the contour informational label into the plot
; - Customizing the contour informational label
;----------------------------------------------------------------------
; This script shows how to plot WRF rain totals on a WRF terrain map,
; using transparency for all rain totals below a certain level.
;----------------------------------------------------------------------
; This script was contributed by Xiao-Ming Hu (xhu@ou.edu)
; Center for Analysis and Prediction of Storms
; University of Oklahoma
;----------------------------------------------------------------------
; These files are loaded by default in NCL V6.2.0 and newer
; load "$NCARG_ROOT/lib/ncarg/nclscripts/csm/gsn_code.ncl"
; load "$NCARG_ROOT/lib/ncarg/nclscripts/csm/gsn_csm.ncl"
; load "$NCARG_ROOT/lib/ncarg/nclscripts/wrf/WRFUserARW.ncl"
begin
idomain = 3 ; 3,3
;---Rain data
f0 = addfile("wrfout_d03_2019-06-11_00:00:00.nc","r")
Times = f0->Times
dims = dimsizes(Times)
RAINC = f0->RAINC(0,:,
RAINNC = f0->RAINNC(0,:,
RainTotal = RAINC
,;---Terrain data
fmap = addfile("wrfout_d03_2019-06-11_00:00:00.nc","r")
HGT = fmap->HGT(0,:,
HGT =(/HGT/1000./)
;---Start the graphics
wks = gsn_open_wks("pdf" ,"WRF_pcp")
;---Set resources for terrain plot
res_ter = True ; plot mods desired
res_ter@gsnFrame = False
res_ter@gsnDraw = False
res_ter@cnFillOn = True ; color plot desired
res_ter@cnFillPalette = "gsltod" ; Select grayscale colormap
res_ter@cnLinesOn = False ; turn off contour lines
res_ter@cnLineLabelsOn = False ; turn off contour labels
res_ter@cnFillMode = "RasterFill"
res_ter@cnFillOpacityF = 1.
res_ter@lbLabelBarOn = False
res_ter@gsnRightString = ""
res_ter = wrf_map_resources(fmap, res_ter) ; set map resources to match those on WRF file
res_ter@tfDoNDCOverlay = True
res_ter@mpOutlineBoundarySets = "AllBoundaries"
res_ter@mpDataSetName = "Earth..4" ; Gives us provincial boundaries
res_ter@mpGeophysicalLineThicknessF = 1.5 ; thickness of map outlines
res_ter@mpProvincialLineThicknessF = 2.
res_ter@mpProvincialLineColor = "black"
res_ter@pmTickMarkDisplayMode = "Always" ; turn on nicer tickmarks
res_ter@tmXBLabelFontHeightF = 0.018
res_ter@tmYLLabelFontHeightF = 0.018
res_ter@tmYLLabelStride = 2 ; label every other tickmark
res_ter@tmXBLabelStride = 2
;---Point the tickmarks inward
res_ter@tmYRMajorOutwardLengthF = 0
res_ter@tmYLMajorOutwardLengthF = 0
res_ter@tmXBMajorOutwardLengthF = 0
res_ter@tmXBMinorOutwardLengthF = 0
res_ter@tmXTOn = True
res_ter@tmYROn = True
res_ter@tmYRLabelsOn = False
res_ter@tmXTLabelsOn = False
;---Set resources for rain total contour plot
res_tot = True
res_tot@gsnFrame = False
res_tot@gsnDraw = False
cmap := read_colormap_file("BlAqGrYeOrReVi200")
cmap(0,
= (/0,0,0,0/) ; make first color fully transparentres_tot@cnFillOn = True
res_tot@cnFillMode = "RasterFill"
res_tot@cnFillPalette = cmap
res_tot@cnLinesOn = False ; turn off contour lines
res_tot@cnLineLabelsOn = False ; turn off contour labels
res_tot@cnFillOpacityF = 1. ; .85
res_tot@tfDoNDCOverlay = True
res_tot@cnLevelSelectionMode = "ManualLevels"
res_tot@cnMaxLevelValF = 42
res_tot@cnMinLevelValF = 2
res_tot@cnLevelSpacingF = 4
res_tot@pmLabelBarHeightF = 0.08 ; Make labelbar less thick
res_tot@lbLabelFontHeightF = 0.014
res_tot@pmLabelBarOrthogonalPosF = -0.008
res_tot@cnInfoLabelOn = True
res_tot@cnInfoLabelString = "Min= $ZMN$ Max= $ZMX$"
res_tot@cnInfoLabelOrthogonalPosF = -0.104 ; move info label into plot
res_tot@tiMainFont = "Helvetica-bold"
res_tot@tiMainFontHeightF = 0.018
res_tot@gsnRightString = "RAIN, mm"
res_tot@gsnLeftString = ""
do ihour = 0, dims(0)-2
istart = ihour
iend = ihour+1
RainTotal = (/(f0->RAINC(iend,:,
+ f0->RAINNC(iend,:, - \(f0->RAINC(istart,:,
+ f0->RAINNC(istart,:,))/1. /)res_tot@tiMainString = "hourly RAINC+RAINNC " +chartostring(f0->Times(iend,
)plot_terrain = gsn_csm_contour_map(wks,HGT,res_ter)
plot_raintot = gsn_csm_contour(wks,RainTotal,res_tot)
overlay(plot_terrain, plot_raintot)
draw(plot_terrain)
frame(wks)
end do ; ihour
end