Scheduled Downtime
On Friday 21 April 2023 @ 5pm MT, this website will be down for maintenance and expected to return online the morning of 24 April 2023 at the latest

WRF-Chem3.9 grid separated field

This post was from a previous version of the WRF&MPAS-A Support Forum. New replies have been disabled and if you have follow up questions related to this post, then please start a new thread from the forum home page.

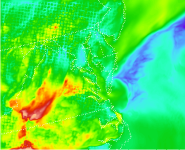
I am running WRF-Chem 3.9 with NEI2011 emission over the eastern US with spatial resolution of 3 km by 3 km. When I plot the output of surface O3 mixing ratio, the field looks like one grid by grid, not continuous between grids. Please see the attached plot. Do you have any thoughts on this? For 4 km by 4 km spatial resolution, there is no this. I do not think it's related to the setup of namelist. Thank you
 

Attachments

  • o3_mixing_ratio.png
    o3_mixing_ratio.png
    198.7 KB · Views: 496
Top