kunaldayal
Member
Hi,
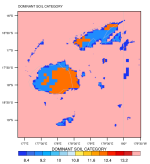
I have plotted the dominant soil categories from the input static data and I need information as to how I can interpret the color and scale.
I am using input static data from 30-arc-second USGS GMTED2010 (Topography), MODIS FPAR (GreenFrac) and 21-class MODIS (LU_Index/Landuse).
Please see attached the plot of the dominant soil categories.
Appreciate your assistance and advice.
Regards
Kunal