Scheduled Downtime
On Friday 21 April 2023 @ 5pm MT, this website will be down for maintenance and expected to return online the morning of 24 April 2023 at the latest

Plotting the output of a regional simulation

This post was from a previous version of the WRF&MPAS-A Support Forum. New replies have been disabled and if you have follow up questions related to this post, then please start a new thread from the forum home page.

Hi mcurry,
I don't have the GWDO error when running on this static mesh. However, I have more one question is that can I plot result with NCL.
I see something in there https://www.ncl.ucar.edu/Applications/mpas.shtml, but no script is used to plot one particular area. Can you have give me some script like that?
Thank you very much!
 
I recommend using the NCL script (regional_cells.ncl) referenced in step 4.5 Visualizing regional output as a good first place to view your regional fields (as well as ncview). You'll need to follow the example in 4.5 to changing the script to plot the field that you want and selecting the correct amount of color levels and the correct color range.

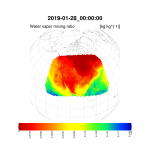
For an additional reference I have attached the regional_cells.ncl file as well as its output of the qv field from a regional MPAS simulation over the Continental United States.

conus-qv.png
 

Attachments

  • regional_cells.ncl.txt
    7.7 KB · Views: 75
Hi Mcurry,
I have another question is that I used 15-km – 3-km mesh to run the limited-area simulation. In the results, I don't know how to plot data with the 15km resolution or the 3km resolution.
Can you give me any suggestions?
Thank you very much!
 
The NCL script that mcurry mentioned plots the model output on its native grid. Each grid cell is drawn as a color-filled polygon in the plot. So in that sense, the 3-km region in the mesh will be plotted at 3-km resolution, and the 15-km region in the mesh will be plotted at 15-km resolution.

If you would like to plot a small region within your simulation domain, you can modify these parameters in the NCL script, beginning around line 77:
Code:
  ;
  ; Set plotting window
  ;
  leftAngle   = 60.0
  rightAngle  = 60.0
  bottomAngle = 60.0
  topAngle    = 60.0
An explanation of these parameters can be found in the "Angles" sub-section of the documentation for mpLimitMode in the NCL documentation.

If I've misunderstood your question, though, please don't hesitate to follow-up.
 
Hi mgduda,
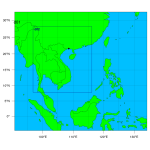
My opinion is that I want to plot one particular area with 2 resolutions, in this case 15km and 3km. For example, in the WRF model, there are 2 domains which are attached in the attachment, after running the WRF model it will create 2 outfiles corresponding with 2 resolutions. That makes me able to plot clearly with particular resolution. 
 

Attachments

  • domain.png
    domain.png
    97.9 KB · Views: 1,701
Top