Alessandro Delo
New member
Hi everyone,
I’m working with WRF output (version 4.4.1, coupled with WRF-HYDRO . v 4.2.0) and I’ve noticed something puzzling that I hope someone can clarify.
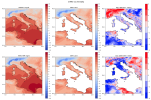
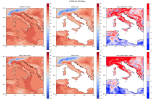
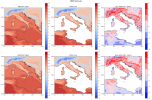
When I compare the 2-meter temperature (T2) values read from the wrfout files (instantaneous outputs every 6 hours) with the T2MEAN variable from the wrfxtrm files, I see significant differences in some grid points when computing daily averages.
I calculated daily means from the instantaneous T2 values (four per day), while T2MEAN comes directly from the wrfxtrm files. Interestingly, when I look at monthly or annual means, these discrepancies become much smaller — but at the daily scale, they are quite large compared to a benchmark dataset like ERA5-Land.
So, I’d like to better understand:
Has anyone encountered this issue or can explain which of the two is preferable for computing daily mean temperature from WRF outputs?
Thanks a lot in advance for your help!
Alessandro
I’m working with WRF output (version 4.4.1, coupled with WRF-HYDRO . v 4.2.0) and I’ve noticed something puzzling that I hope someone can clarify.
When I compare the 2-meter temperature (T2) values read from the wrfout files (instantaneous outputs every 6 hours) with the T2MEAN variable from the wrfxtrm files, I see significant differences in some grid points when computing daily averages.
I calculated daily means from the instantaneous T2 values (four per day), while T2MEAN comes directly from the wrfxtrm files. Interestingly, when I look at monthly or annual means, these discrepancies become much smaller — but at the daily scale, they are quite large compared to a benchmark dataset like ERA5-Land.
So, I’d like to better understand:
- What exactly is saved in wrfxtrm for T2MEAN?
- Is it really the average of all model timesteps (in my case, every 30 seconds)?
- Does it make sense to compare T2MEAN with the daily mean computed from wrfout files, given that I only have 4 instantaneous values per day and may not be capturing the full diurnal cycle?
Has anyone encountered this issue or can explain which of the two is preferable for computing daily mean temperature from WRF outputs?
Thanks a lot in advance for your help!
Alessandro