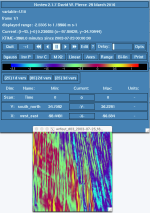
What could be causing these streaks in the attached image? This image shows WRF output of the variable U10 for a simulation run over 2003 7/25 @18:00Z centered on Oklahoma City. I used CFSR data as initial conditions with the following name list options. The model was run from 7/23 - 7/28 so there should be proper spin up prior to this time.
Additionally, there also seems to be some non-physical discontinuities along the border... Has anyone else seen this type of behavior? I have been struggling with issues like this for a while now and would really like to find a solution. Thanks!
&time_control
run_days = 0,
run_hours = 120,
run_minutes = 0,
run_seconds = 0,
start_year = 2003, 2003, 2003, 2003,
start_month = 7, 7, 7, 7,
start_day = 23, 23, 23, 23,
start_hour = 0, 0, 0, 0,
start_minute = 00, 00, 00, 00,
start_second = 00, 00, 00, 00,
end_year = 2003, 2003, 2003, 2003,
end_month = 7, 7, 7, 7,
end_day = 28, 28, 28, 28,
end_hour = 0, 0, 0, 0,
end_minute = 00, 00, 00, 00,
end_second = 00, 00, 00, 00,
interval_seconds = 10800,
input_from_file = .true., .true., .true., .true.,
history_interval = 60, 60, 5, 360,
frames_per_outfile = 1, 1, 1, 1,
auxinput11_interval_s = 180, 180, 180, 180,
auxinput11_end_h = 6, 6, 6, 6,
restart = .false.,
restart_interval = 60,
io_form_history = 2,
io_form_restart = 2,
io_form_input = 2,
io_form_boundary = 2,
debug_level = 0,
force_use_old_data = T,
/
&domains
use_adaptive_time_step = .true.
step_to_output_time = .true.
time_step = 150,
time_step_fract_num = 0,
time_step_fract_den = 1,
max_dom = 3,
e_we = 151, 151, 151,
e_sn = 151, 151, 151,
e_vert = 37, 37, 37, 37,
dx = 10000, 3333.3, 1111.1,
dy = 10000, 3333.3, 1111.1,
p_top_requested = 5000,
num_metgrid_levels = 38,
num_metgrid_soil_levels = 4,
sfcp_to_sfcp = .true.,
grid_id = 1, 2, 3, 4,
parent_id = 0, 1, 2, 3,
i_parent_start = 1, 51, 51, 28,
j_parent_start = 1, 51, 51, 22,
parent_grid_ratio = 1, 3, 3, 3,
parent_time_step_ratio = 1, 3, 3, 3,
feedback = 0,
smooth_option = 0,
eta_levels = 1.000000, 0.996200, 0.989737, 0.982460, 0.974381,
0.965422, 0.955498, 0.944507, 0.932347, 0.918907,
0.904075, 0.887721, 0.869715, 0.849928, 0.828211,
0.804436, 0.778472, 0.750192, 0.719474, 0.686214,
0.650339, 0.611803, 0.570656, 0.526958, 0.480854,
0.432582, 0.382474, 0.330973, 0.278674, 0.226390,
0.175086, 0.132183, 0.096211, 0.065616, 0.039773,
0.018113, 0.000000,
/
&physics
mp_physics = 8, 8, 8, 8,
progn = 1, 1, 1, 1,
ra_lw_physics = 1, 1, 1, 1,
ra_sw_physics = 1, 1, 1, 1,
radt = 10, 10, 10, 20,
sf_sfclay_physics = 1, 1, 1, 1,
sf_surface_physics = 2, 2, 2, 2,
bl_pbl_physics = 1, 1, 1, 1,
bldt = 0, 0, 0, 0,
cu_physics = 0, 0, 0, 0,
cudt = 5, 5, 5, 0,
sf_urban_physics = 0, 0, 0, 0,
isfflx = 1,
ifsnow = 1,
icloud = 1,
surface_input_source = 1,
num_soil_layers = 4,
num_land_cat = 21,
maxiens = 1,
maxens = 3,
maxens2 = 3,
maxens3 = 16,
ensdim = 144,
cu_rad_feedback = .false.,
cugd_avedx = 1,
mp_zero_out = 2,
mp_zero_out_thresh = 1.e-8,
cu_diag = 0,
slope_rad = 1, 1, 1,
/
&dynamics
w_damping = 1,
diff_opt = 1,
km_opt = 4,
base_temp = 290.,
damp_opt = 3,
zdamp = 5000., 5000., 5000., 5000.,
dampcoef = 0.15, 0.15, 0.15, 0.2,
khdif = 0, 0, 0, 0,
kvdif = 0, 0, 0, 0,
non_hydrostatic = .true., .true., .true., .true.,
moist_adv_opt = 1, 1, 1, 4,
scalar_adv_opt = 1, 1, 1, 4,
tke_adv_opt = 1, 1, 1, 4,
/
&bdy_control
spec_bdy_width = 5,
spec_zone = 1,
relax_zone = 4,
specified = .true., .false., .false., .false.,
nested = .false., .true., .true., .true.,
/
&namelist_quilt
nio_tasks_per_group = 0,
nio_groups = 1,
/
&fdda
obs_nudge_opt = 0,0,0,0,0
max_obs = 150000,
fdda_start = 0., 0., 0., 0., 0.
fdda_end = 99999., 99999., 99999., 99999., 99999.
obs_nudge_wind = 1,1,1,1,1
obs_coef_wind = 8.E-4,8.E-4,8.E-4,6.E-4,6.E-4
obs_nudge_temp = 1,1,1,1,1
obs_coef_temp = 8.E-4,8.E-4,8.E-4,6.E-4,6.E-4
obs_nudge_mois = 1,1,1,1,1
obs_coef_mois = 8.E-4,8.E-4,8.E-4,6.E-4,6.E-4
obs_rinxy = 240.,240.,180.,180,180
obs_rinsig = 0.1,
obs_twindo = 0.6666667,0.6666667,0.6666667,0.6666667,0.6666667,
obs_npfi = 10,
obs_ionf = 2, 2, 2, 2, 2,
obs_idynin = 0,
obs_dtramp = 40.,
obs_prt_freq = 10, 10, 10, 10, 10,
obs_prt_max = 10
obs_ipf_errob = .true.
obs_ipf_nudob = .true.
obs_ipf_in4dob = .true.
obs_ipf_init = .true.
/