Scheduled Downtime
On Friday 21 April 2023 @ 5pm MT, this website will be down for maintenance and expected to return online the morning of 24 April 2023 at the latest

Compressible Equations Mass Continuity Inquiry (CM1 V20.3)

aroseman

Member
Hi, I have been running quite a few runs using the (1) fully-compressible equations, (2) using horizontally uniform interpolated real sounding in CM1 V20.3. (3) BCs are open in x and periodic in y. (4) 1 km horiz res, Nx=500, Ny=100, Nz = 34, Ztop = 20km (have also tried higher z res and model top in other runs).

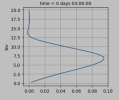
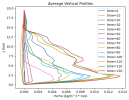
I noticed that the average vertical profile of w and rho*w are curiously almost always positive. Is this kind of positive bias expected in the compressible case?
 

Attachments

  • vertical_profiles.png
    vertical_profiles.png
    91.6 KB · Views: 3
Last edited:
Hi @aroseman! i ran the CM1 squall line test case because it has the same BCs and horizontal res as your run. Here is the average vertical profile of rho*w at 3 hours (Attached). The maximum is several km higher than yours and there are some negative values, but not much. There are probably other differences in the simulations, but the fact that there is so little negative area in my run makes me think your results are not that unusual. I'm not sure how to reproduce the histogram you made. For reference, my namelist was CM1/run/config_files/squall_line/namelist.input at main · NCAR/CM1
 

Attachments

  • Screenshot 2025-10-23 at 2.23.23 PM.png
    Screenshot 2025-10-23 at 2.23.23 PM.png
    51.3 KB · Views: 10
I have done some investigation in the past. I found that incompressible mass terms are somewhat not conserved, however adding in density tendency seemed to improve the error. Though I haven't been able to directly calculate that during the model run.

@gbryan Any thoughts on this?
 
Last edited:
The histogram would be simply taking say 1000 random values throughout the domain and making a histogram.
I am confused by the y-axis label for the histogram. It says count x 10^6. Perhaps it is supposed to be height in km? isn't it more of a scatterplot than a histogram?
 
Ah my apologies, the y axis was actually supposed to be z but the labels somehow got messed up. I made a more informative plot above.
 
Last edited:
Top