You are using an out of date browser. It may not display this or other websites correctly.
You should upgrade or use an alternative browser.
You should upgrade or use an alternative browser.
Creating a time series plot between different simulations
- Thread starter thenaga021
- Start date
thenaga021
New member
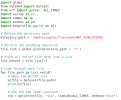
Hello, I already obtained the 3 hourly time series plot of mlsp and plot the different simulations.
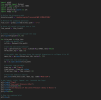
However, I want to narrow it down further. I want to obtain the mslp for every 3 hours at specific latitude and longitude for different simulations. Like this
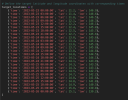
But I do not know construct it.
Also as I looked the data in excel, the values of slp wrt the lat and long for my first target location from one of my simulations looked like this

Hoping for some help. Thank you.

However, I want to narrow it down further. I want to obtain the mslp for every 3 hours at specific latitude and longitude for different simulations. Like this

But I do not know construct it.
Also as I looked the data in excel, the values of slp wrt the lat and long for my first target location from one of my simulations looked like this

Hoping for some help. Thank you.
Last edited:
William.Hatheway
Active member
If no one has an answer, try this forum too.
WRF-Python users forum:
 groups.google.com
WRF-Python users forum:
wrfpython-talk - Google Groups
 groups.google.com
thenaga021
New member
Hello, I made a mistake on what should I look for. I am suppose to obtain the minimum sea level pressure not the mean sea level pressure. Then correlate it to the central pressure from JMA. I also changed it to six hour period. The updated code is attached below.
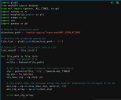
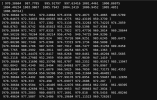
Now my problem is to determine the lats and lons of each value of the minimum sea level pressure to differentiate it to the lats and lons of JMA.


Now my problem is to determine the lats and lons of each value of the minimum sea level pressure to differentiate it to the lats and lons of JMA.
Can you try the function np.where(a == a.min())?
You can also find possibly helpful information at Getting the index of the returned max or min item using max()/min() on a list
You can also find possibly helpful information at Getting the index of the returned max or min item using max()/min() on a list

