Hello everyone,
I have a small climate-modeling brain teaser that I hope some of you may find interesting.
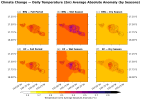
I am analyzing future temperature projections over Tahiti (French Polynesia) using WRF at 2.3 km resolution. As expected under global warming, mean near-surface temperature increases in the future simulations, with the strongest warming signal generally occurring over the north-west (leeward) coast of the island (Figure 1).
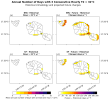
However, when I examine the annual number of days exceeding a fixed temperature threshold (e.g., 32°C), I obtain a rather counterintuitive result: the largest increase in exceedance days occurs along the trade-wind-exposed (windward) coasts, particularly on the eastern and southern sides of the island (Figure 2).
What makes this even more puzzling is that historical in-situ observations suggest that threshold exceedances are currently more frequent on the north-west coast, which is generally warmer, sunnier, and less ventilated.
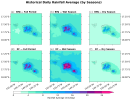
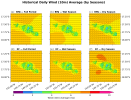
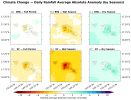
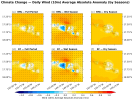
To provide additional context, I also include precipitation and wind maps (Figures 3 and 4), which illustrate the cloudiness and ventilation patterns. These fields show only limited changes between the historical and future simulations.
I suspect that several interacting processes may be involved, including:
Any thoughts or suggestions for additional diagnostics would be greatly appreciated.
Thank you!
I have a small climate-modeling brain teaser that I hope some of you may find interesting.
I am analyzing future temperature projections over Tahiti (French Polynesia) using WRF at 2.3 km resolution. As expected under global warming, mean near-surface temperature increases in the future simulations, with the strongest warming signal generally occurring over the north-west (leeward) coast of the island (Figure 1).
However, when I examine the annual number of days exceeding a fixed temperature threshold (e.g., 32°C), I obtain a rather counterintuitive result: the largest increase in exceedance days occurs along the trade-wind-exposed (windward) coasts, particularly on the eastern and southern sides of the island (Figure 2).
What makes this even more puzzling is that historical in-situ observations suggest that threshold exceedances are currently more frequent on the north-west coast, which is generally warmer, sunnier, and less ventilated.
To provide additional context, I also include precipitation and wind maps (Figures 3 and 4), which illustrate the cloudiness and ventilation patterns. These fields show only limited changes between the historical and future simulations.
I suspect that several interacting processes may be involved, including:
- surface radiative forcing,
- cloud feedbacks,
- temperature and moisture advection,
- land-sea interactions,
- changes in the diurnal temperature cycle,
- and possibly differences in temperature variability rather than mean warming alone.
Any thoughts or suggestions for additional diagnostics would be greatly appreciated.
Thank you!