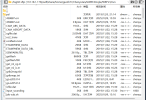
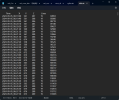
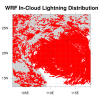
I'm trying to plot a lightning density map for a typhoon using NCL, but I'm unsure what code to use. I used code provided by a classmate to plot a cloud-to-ground lightning density map, but it always looks odd to me. Please help me.The first image shows the output results from my WRF model, with the icfile containing my cloud flash location data.The second image shows the data diagram from icfile.dat. To be honest, I'm not quite sure what “Lines” refers to.The third image was created using the following code.
The code I used is as follows:
load "$NCARG_ROOT/lib/ncarg/nclscripts/csm/gsn_code.ncl"
load "$NCARG_ROOT/lib/ncarg/nclscripts/csm/gsn_csm.ncl"
load "$NCARG_ROOT/lib/ncarg/nclscripts/wrf/WRFUserARW.ncl"
begin
;-----------------------------------------------------------
; 1. WRF 文件(用于获取经纬度)
;-----------------------------------------------------------
fip = "/share/home/guofx77/chenyutan/GWRF4mojie/WRFV3/run/"
fin = "wrfout_d02_2024-09-05_06:00:00"
f = addfile(fip + fin, "r")
lat2d = wrf_user_getvar(f, "lat", 0)
lon2d = wrf_user_getvar(f, "lon", 0)
;-----------------------------------------------------------
; 2. 读取 IC 闪电文件
;-----------------------------------------------------------
fn = "/share/home/guofx77/chenyutan/GWRF4mojie/WRFV3/run/icfile.dat"
a = asciiread(fn, -1, "string")
X_ic = toint( str_get_field(a(1") , 2, " ") )
, 2, " ") )
Y_ic = toint( str_get_field(a(1, 3, " ") )
Z_ic = tofloat( str_get_field(a(1, 4, " ") )
npts = dimsizes(X_ic)
print("IC lightning points: " + npts)
;-----------------------------------------------------------
; 3. 将网格索引转换为经纬度
;----------------------------------------------------------
lat_ic = new(npts, float)
lon_ic = new(npts, float)
do i = 0, npts-1
lat_ic(i) = lat2d(Y_ic(i), X_ic(i))
lon_ic(i) = lon2d(Y_ic(i), X_ic(i))
end do
;-----------------------------------------------------------
; 4. 打开绘图窗口
;-----------------------------------------------------------
wks = gsn_open_wks("png", "IC_lightning_distribution")
;-----------------------------------------------------------
; 5. 地图资源设置
;-----------------------------------------------------------
res = True
res@gsnMaximize = True
res@gsnAddCyclic = False
res@mpLimitMode = "LatLon"
res@mpMinLatF = min(lat2d)
res@mpMaxLatF = max(lat2d)
res@mpMinLonF = min(lon2d)
res@mpMaxLonF = max(lon2d)
res@mpOutlineOn = True
res@mpGridAndLimbOn = True
res@mpGridLatSpacingF = 1.0
res@mpGridLonSpacingF = 1.0
res@mpGridLineColor = "gray60"
res@tiMainString = "WRF In-Cloud Lightning Distribution"
;----------------------------------------------------------
; 6. 先画一张空地图
;-----------------------------------------------------------
map = gsn_csm_map(wks, res)
;-----------------------------------------------------------
; 7. 云闪点绘制参数
;-----------------------------------------------------------
pmres = True pmres = 真
pmres@gsMarkerIndex = 16 ; 实心圆
pmres@gsMarkerColor = "red"
pmres@gsMarkerColor = “红色”
pmres@gsMarkerSizeF = 0.004
;-----------------------------------------------------------
; 8. 叠加 IC 闪电点
;-----------------------------------------------------------
dum = gsn_add_polymarker(wks, map, lon_ic, lat_ic, pmres)
dum = gsn_add_polymarker(WKS、MAP、lon_ic、lat_ic、PMRES)
draw(map) 绘制(地图)
frame(wks) 帧(周)
print("? 云闪(IC)分布图绘制完成:IC_lightning_distribution.png")
end 结束
The code I used is as follows:
load "$NCARG_ROOT/lib/ncarg/nclscripts/csm/gsn_code.ncl"
load "$NCARG_ROOT/lib/ncarg/nclscripts/csm/gsn_csm.ncl"
load "$NCARG_ROOT/lib/ncarg/nclscripts/wrf/WRFUserARW.ncl"
begin
;-----------------------------------------------------------
; 1. WRF 文件(用于获取经纬度)
;-----------------------------------------------------------
fip = "/share/home/guofx77/chenyutan/GWRF4mojie/WRFV3/run/"
fin = "wrfout_d02_2024-09-05_06:00:00"
f = addfile(fip + fin, "r")
lat2d = wrf_user_getvar(f, "lat", 0)
lon2d = wrf_user_getvar(f, "lon", 0)
;-----------------------------------------------------------
; 2. 读取 IC 闪电文件
;-----------------------------------------------------------
fn = "/share/home/guofx77/chenyutan/GWRF4mojie/WRFV3/run/icfile.dat"
a = asciiread(fn, -1, "string")
X_ic = toint( str_get_field(a(1
, 2, " ") )Y_ic = toint( str_get_field(a(1
, 3, " ") )Z_ic = tofloat( str_get_field(a(1
, 4, " ") )npts = dimsizes(X_ic)
print("IC lightning points: " + npts)
;-----------------------------------------------------------
; 3. 将网格索引转换为经纬度
;----------------------------------------------------------
lat_ic = new(npts, float)
lon_ic = new(npts, float)
do i = 0, npts-1
lat_ic(i) = lat2d(Y_ic(i), X_ic(i))
lon_ic(i) = lon2d(Y_ic(i), X_ic(i))
end do
;-----------------------------------------------------------
; 4. 打开绘图窗口
;-----------------------------------------------------------
wks = gsn_open_wks("png", "IC_lightning_distribution")
;-----------------------------------------------------------
; 5. 地图资源设置
;-----------------------------------------------------------
res = True
res@gsnMaximize = True
res@gsnAddCyclic = False
res@mpLimitMode = "LatLon"
res@mpMinLatF = min(lat2d)
res@mpMaxLatF = max(lat2d)
res@mpMinLonF = min(lon2d)
res@mpMaxLonF = max(lon2d)
res@mpOutlineOn = True
res@mpGridAndLimbOn = True
res@mpGridLatSpacingF = 1.0
res@mpGridLonSpacingF = 1.0
res@mpGridLineColor = "gray60"
res@tiMainString = "WRF In-Cloud Lightning Distribution"
;----------------------------------------------------------
; 6. 先画一张空地图
;-----------------------------------------------------------
map = gsn_csm_map(wks, res)
;-----------------------------------------------------------
; 7. 云闪点绘制参数
;-----------------------------------------------------------
pmres = True pmres = 真
pmres@gsMarkerIndex = 16 ; 实心圆
pmres@gsMarkerColor = "red"
pmres@gsMarkerColor = “红色”
pmres@gsMarkerSizeF = 0.004
;-----------------------------------------------------------
; 8. 叠加 IC 闪电点
;-----------------------------------------------------------
dum = gsn_add_polymarker(wks, map, lon_ic, lat_ic, pmres)
dum = gsn_add_polymarker(WKS、MAP、lon_ic、lat_ic、PMRES)
draw(map) 绘制(地图)
frame(wks) 帧(周)
print("? 云闪(IC)分布图绘制完成:IC_lightning_distribution.png")
end 结束
Attachments
Last edited: