Jayanti pal
Member
I would like to plot wind of simulated idealize super cell case using ncl
here is the details of file (wrfout)
dimensions:
Time = UNLIMITED ; // (49 currently)
DateStrLen = 19 ;
west_east = 41 ;
south_north = 41 ;
bottom_top = 40 ;
bottom_top_stag = 41 ;
soil_layers_stag = 5 ;
west_east_stag = 42 ;
south_north_stag = 42 ;
seed_dim_stag = 8 ;
Here below I have attached a ncl file. as .ncl is not supported file, I have convert it into .txt file. While i runned that I got error
warning:ContourPlotInitialize: scalar field is constant; no contour lines will appear; use cnConstFEnableFill to enable fill
(0) gsn_csm_map_ce: Fatal: The resources mpMinLatF/mpLeftCornerLatF must be less than the resources mpMaxLatF/mpRightCornerF.
(0) Execution halted.
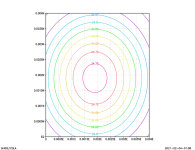
So I plot a variable in grads and pic of it is attached below.
I dont understand where is the mistake??
kindly help.

