Hi all,
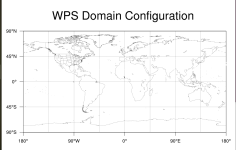
I am using plotgrids_new to plot the domain generated in the namelist.wps file. The project is 'lat-lon'. The generated image is attached. I have defined a nested domain, which plotgrids does not generate. Apart from that the image is B&W, how can I generate a color image distinguishing sea and land for example.
Both the generated image and the namelist files are attached.
Thanks a lot,
Joseph