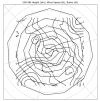
How do I get rid of the circular artifacts from this WRF plot of 500 mb heights?

I have tried copy/pasting the sample code from wrf-python with Cartopy (Plotting Examples — wrf-python 1.4.0 documentation) and got a similar result to my current code. I am running a polar stereographic domain in WRF and using the following Python code to plot:

I have tried copy/pasting the sample code from wrf-python with Cartopy (Plotting Examples — wrf-python 1.4.0 documentation) and got a similar result to my current code. I am running a polar stereographic domain in WRF and using the following Python code to plot:
Code:
# Packages needed for plotting
import cartopy.crs as ccrs
import matplotlib.pyplot as plt
from matplotlib.cm import get_cmap
import numpy as np


# Packages needed for handling data
from netCDF4 import Dataset
import wrf


# Specify the WRF output file path
a = "jan-3-2000-00.nc"


# Open the NetCDF file using Dataset
ncfile = Dataset(a)


# read in p and z
p = wrf.getvar(ncfile, "pressure")
z = wrf.getvar(ncfile, "z", units="dm")


# Interpolate height to pressure level
z_500 = wrf.vinterp(ncfile, field=z,
                        vert_coord="pressure",
                        interp_levels=[500],
                        extrapolate=False,
                        field_type="pressure")


# Get latitude and longitude coordinates
lats, lons = wrf.latlon_coords(p)


# Get the map projection information
cart_proj = wrf.get_cartopy(p)


# Create the figure
fig = plt.figure(figsize=(12,9))
ax = plt.axes(projection=cart_proj)


# Add the 500 hPa geopotential height contours
nlevels = np.arange(480., 580., 6.)


contours = plt.contour(lons, lats, z_500[0,:,:],
                       levels=nlevels,
                       colors="black",
                       transform=ccrs.PlateCarree())
plt.clabel(contours, inline=1, fontsize=10, fmt="%i")


ax.gridlines()


plt.title("500 MB Height (dm), Wind Speed (kt), Barbs (kt)")


plt.show()