Dear @mgduda,
I hope this message finds you well. I am currently working with MPAS-A simulations to study the dynamics of Cut-off Lows (COLs) and facing challenges in accurately calculating potential vorticity (PV). My goal is to calculate MPAS-A potential vorticity and use it to study the dynamics of COLs in MPAS. First, I embark on testing how to calculate the potential vorticity using the existing reanalysis dataset just to build confidence in the potential vorticity equations. Despite using existing tools like NCL and MetPy, there are discrepancies between my calculated PV and ERA5 reanalysis data.
Methods I have tried:
1. NCL Script (`port_vort_isobaric`):
I utilized the NCL function `port_vort_isobaric` to calculate potential vorticity using global zonal and meridional wind and temperature variables from ERA5 reanalysis. However, the calculated PV differs by approximately > +/ - 3.0 PVU from the ERA5 potential vorticity variable.
2. MetPy Function (`potential_vorticity_baroclinic()`):
I also experimented with MetPy's `potential_vorticity_baroclinic()` function. Unfortunately, the results still deviated from the reanalysis data.
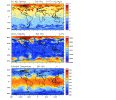
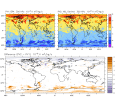
I have prepared figures illustrating the discrepancies between my calculated PV and ERA5 data. These figures highlight the differences at specific altitudes (300 hPa). Figure 1 or the first figure shows the spatial distribution of PV, Static stability, and the potential temperature from the NCL port_vort_isobaric while the second figure compares the calculated PV and the ERA5 dataset, as well as shows the bias in the calculated PV.

Figure 1
View attachment 12624
Figure 2
Specific Questions:
1. Is it possible to obtain the potential vorticity variable directly from MPAS-A without needing to manually calculate it?
2. If not, could you guide me on how to calculate PV using Fortran and incorporate it into MPAS-A?
Incorporating it into MPAS because I am unsure about post-processing MPAS-A results at a full global scale and how `convert_mpas` would handle variable grid results. Most suggestions online state that it is better to calculate potential vorticity at a global scale and I think it may be much easier or better to incorporate potential vorticity calculation directly into MPAS than post-processing variable resolution output from MPAS at a global scale using convert_mpas util. I do not know why I have such a thought.
Your expertise would be immensely valuable in addressing these challenges. Thank you for your time and assistance.
Best regards,
Makinde
I hope this message finds you well. I am currently working with MPAS-A simulations to study the dynamics of Cut-off Lows (COLs) and facing challenges in accurately calculating potential vorticity (PV). My goal is to calculate MPAS-A potential vorticity and use it to study the dynamics of COLs in MPAS. First, I embark on testing how to calculate the potential vorticity using the existing reanalysis dataset just to build confidence in the potential vorticity equations. Despite using existing tools like NCL and MetPy, there are discrepancies between my calculated PV and ERA5 reanalysis data.
Methods I have tried:
1. NCL Script (`port_vort_isobaric`):
I utilized the NCL function `port_vort_isobaric` to calculate potential vorticity using global zonal and meridional wind and temperature variables from ERA5 reanalysis. However, the calculated PV differs by approximately > +/ - 3.0 PVU from the ERA5 potential vorticity variable.
2. MetPy Function (`potential_vorticity_baroclinic()`):
I also experimented with MetPy's `potential_vorticity_baroclinic()` function. Unfortunately, the results still deviated from the reanalysis data.
I have prepared figures illustrating the discrepancies between my calculated PV and ERA5 data. These figures highlight the differences at specific altitudes (300 hPa). Figure 1 or the first figure shows the spatial distribution of PV, Static stability, and the potential temperature from the NCL port_vort_isobaric while the second figure compares the calculated PV and the ERA5 dataset, as well as shows the bias in the calculated PV.
Figure 1
View attachment 12624
Figure 2
Specific Questions:
1. Is it possible to obtain the potential vorticity variable directly from MPAS-A without needing to manually calculate it?
2. If not, could you guide me on how to calculate PV using Fortran and incorporate it into MPAS-A?
Incorporating it into MPAS because I am unsure about post-processing MPAS-A results at a full global scale and how `convert_mpas` would handle variable grid results. Most suggestions online state that it is better to calculate potential vorticity at a global scale and I think it may be much easier or better to incorporate potential vorticity calculation directly into MPAS than post-processing variable resolution output from MPAS at a global scale using convert_mpas util. I do not know why I have such a thought.
Your expertise would be immensely valuable in addressing these challenges. Thank you for your time and assistance.
Best regards,
Makinde


