Hi all,
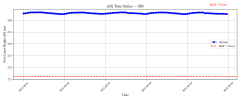
I'm running WRF for a multi-day summer case (August 2022) over a subtropical urban area. The temperature simulation is fairly accurate, but I observed a consistent underestimation of relative humidity after the first day of simulation. On the first day, RH matches observations reasonably well, but from the second day onward, the daily maximum RH becomes increasingly underestimated, especially during the daytime and at night.


I’ve tested several physical scheme combinations to address this issue:
My question is:
1、Could this issue be caused by the lack of updated lateral boundary conditions?
2、Would using FDDA (Four-Dimensional Data Assimilation) or nudging with daily reanalysis (e.g., ERA5) help maintain water vapor consistency and reduce RH bias?
Any suggestions or related experiences would be greatly appreciated!
Thanks in advance!
PS: namelist.input
I'm running WRF for a multi-day summer case (August 2022) over a subtropical urban area. The temperature simulation is fairly accurate, but I observed a consistent underestimation of relative humidity after the first day of simulation. On the first day, RH matches observations reasonably well, but from the second day onward, the daily maximum RH becomes increasingly underestimated, especially during the daytime and at night.
I’ve tested several physical scheme combinations to address this issue:
- Changed land surface model from Noah (sf_surface_physics = 2) to Noah-MP (sf_surface_physics = 4)
- Switched PBL scheme from bl_pbl_physics = 7 to MYNN (bl_pbl_physics = 5)
- Updated radiation schemes to RRTMGto better match the new PBL:
- ra_lw_physics = 4 (RRTMG longwave)
- ra_sw_physics = 4 (RRTMG shortwave)
My question is:
1、Could this issue be caused by the lack of updated lateral boundary conditions?
2、Would using FDDA (Four-Dimensional Data Assimilation) or nudging with daily reanalysis (e.g., ERA5) help maintain water vapor consistency and reduce RH bias?
Any suggestions or related experiences would be greatly appreciated!
Thanks in advance!
PS: namelist.input
&physics
physics_suite = 'CONUS'
mp_physics = 5, 5, 5,
cu_physics = 1, 0, 0,
ra_lw_physics = 4, 4, 4,
ra_sw_physics = 4, 4, 4,
bl_pbl_physics = 5, 5, 5,
sf_sfclay_physics = 1, 1, 1,
sf_surface_physics = 4, 4, 4,
radt = 10, 10, 10,
bldt = 10, 10, 10,
cudt = 5, 0, 0,
icloud = 1,
num_land_cat = 61,
num_soil_layers = 4,
sf_urban_physics = 1, 1, 1,
sf_surface_mosaic = 1,
mosaic_cat = 3,
slucm_distributed_drag = .false.,
use_wudapt_lcz = 1,