Scheduled Downtime
On Friday 21 April 2023 @ 5pm MT, this website will be down for maintenance and expected to return online the morning of 24 April 2023 at the latest

Results at domain edges for limited-area simulations

Hello,
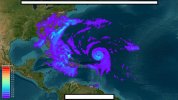
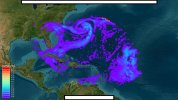
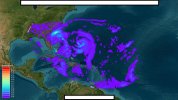
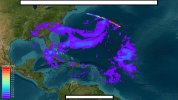
I'm analyzing some limited-area MPAS simulations into greater detail. Most of the general variables (e.g. wind speed) look like good, but the variables related to rain exhibit an unexpected phenomenon. The script doesn't add any extra variables so that rain-related variables include:
i_rainnc, rainnc, precipw, cuprec, i_rainc, rainc
It seems that 'cuprec' is the only variable quantifying rainfall rate so that has been the focus. The plots show bands of heavy rain at the domain edges that don't seem to be physically accurate. These bands appear intermittently and their locations move around as shown in the screenshots. I understand that the domain boundaries are always tricky in limited-area simulations but was wondering if anyone has noticed this behavior (maybe even with another variable). I was also wondering if they might show any sensitivity to resolution (haven't had time to perform any testing to check this hypothesis).
Thanks,
Arturo
 

Attachments

  • bands_001.jpg
    bands_001.jpg
    207.7 KB · Views: 1
  • bands_002.jpg
    bands_002.jpg
    216.1 KB · Views: 1
  • bands_003.jpg
    bands_003.jpg
    209.6 KB · Views: 1
  • bands_004.jpg
    bands_004.jpg
    206.1 KB · Views: 1
Arturo,
Regional MPAS lateral boundary zone contains 2-layer specified cells and 5-layer relaxation zone cells. In those specified zone cells, all variables are the same as the large scale forcing data, which leads to results inconsistent along the boundary.
When looking at simulations of regional MPAS, it is recommended to exclude results in these boundary zone cells.
Hope this is helpful for you. Please let me know if you have more questions.
 
Hi Ming,
Thanks for the insight. I understand the setup for the domain boundaries and that the results accuracy can be lower than for the bulk of the domain. However, I'm still trying to wrap my arms around which type of forcing could be causing the rainfall rate to rise so dramatically (which is particularly noticeable when it shows versus the rain due to the hurricanes). I'll continue looking into it but let me turn to your recommendation. The generation of csv files depends on lat/lon and the closest cells so as long as the locations are not within the boundaries, there should be no problem. The problem is mostly about plotting so let me ask you a couple of follow-up questions:
Q1 - Is there any switch to turn off the outputs on the cells when bdyMaskCell is somewhere between 1 through 7? I mean that the history files would be only include cells for which bdyMaskCell is equal to zero.
Q2 - If not, this would require the manipulation of the outputs. As bdyMaskCell seems to be only available from the grid file (although it probably can be included in the history files as an added variable), your recommended procedure would be something like:
Step 1 - Read bdyMaskCell for each cell from either the grid or history file
Step 2 - Read all other variables of interest from the history file
Step 3 - Write either to a new file or to memory the updated (and shrank) output
Step 4 - Plot the new output
Dealing with variables at vertices or edges would be more sophisticated but it can wait. Is this somewhat close to what you were suggesting or am I missing anything?
Thanks,
Arturo
 
Hi Arturo,
Please see my answers below:
Hi Ming,
Thanks for the insight. I understand the setup for the domain boundaries and that the results accuracy can be lower than for the bulk of the domain. However, I'm still trying to wrap my arms around which type of forcing could be causing the rainfall rate to rise so dramatically (which is particularly noticeable when it shows versus the rain due to the hurricanes). I'll continue looking into it but let me turn to your recommendation. The generation of csv files depends on lat/lon and the closest cells so as long as the locations are not within the boundaries, there should be no problem. The problem is mostly about plotting so let me ask you a couple of follow-up questions:
Q1 - Is there any switch to turn off the outputs on the cells when bdyMaskCell is somewhere between 1 through 7? I mean that the history files would be only include cells for which bdyMaskCell is equal to zero.
There is no option to exclude outputs on cells in the lateral boundary zone.
Q2 - If not, this would require the manipulation of the outputs. As bdyMaskCell seems to be only available from the grid file (although it probably can be included in the history files as an added variable), your recommended procedure would be something like:
Step 1 - Read bdyMaskCell for each cell from either the grid or history file
Step 2 - Read all other variables of interest from the history file
Step 3 - Write either to a new file or to memory the updated (and shrank) output
Step 4 - Plot the new output
Personally I don't go through such a complicated process. Usually I read variables on all cells, then specify their values to a missing value (e.g., -999) on cells in the boundary zone. I suppose this is an easy way to handle regional MPAS data.
Dealing with variables at vertices or edges would be more sophisticated but it can wait. Is this somewhat close to what you were suggesting or am I missing anything?
This is a good question. I haven't done this before ....
Thanks,
Arturo
Hope this is helpful for you.
 
You're right: Masking those cells is much faster if nothing else needs to be done (not sure what I was thinking because I'm already masking the cells without rain so it'd simply be adding the lateral boundary zone cells to them).
 
Top