Scheduled Downtime
On Friday 21 April 2023 @ 5pm MT, this website will be down for maintenance and expected to return online the morning of 24 April 2023 at the latest

Strange representation in wrf-python

janac4

Member
Hello everyone,
For a while I have been using successfully wrf-python version 1.3.2.6, but recently a colleague of mine tried extractig cape_2d with wrf-python and found strange patterns in the map, the same happened with slp variable:
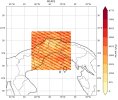
cape_wrong.jpegslp_wrong.jpeg
However terrain variable (also extracted with wrf-python) seems fine:
ter_right.jpeg

I have tried using his code to reproduce the results... but I couldn't! I got correct values, for example with CAPE:
cape_right.jpeg
Does it make any sense? His version is the latest one, 1.3.4.1. The code to get the results is the following:

Code:
import numpy as np
import matplotlib.pyplot as plt
import cartopy.crs as ccrs
from netCDF4 import Dataset
from wrf import (getvar, interplevel, smooth2d, to_np, latlon_coords,
                 get_cartopy, cartopy_xlim, cartopy_ylim)
ncfile = Dataset("wrfout")
slp = getvar(ncfile, "slp")
cape_2d = getvar(ncfile, "cape_2d")
ter = getvar(ncfile, "ter")

mcape = cape_2d.isel(mcape_mcin_lcl_lfc=0)
lats, lons = latlon_coords(cape_2d)
lons_np = to_np(lons)
lats_np = to_np(lats)

var = mcape
var_np = to_np(var)
fig = plt.figure(figsize=(12,8))
ax = plt.axes(projection=ccrs.PlateCarree())
var_min = np.min(var_np)
var_max = np.max(var_np)
var_levels = np.linspace(var_min, var_max, 10)
var_levels = np.linspace(0, 3650, 10)
var_contours = ax.contourf(lons_np, lats_np, var_np,
                             levels=var_levels,
                             transform=ccrs.PlateCarree(),
                             cmap="YlOrRd", extend='both')
plt.colorbar(var_contours, label="")
ax.coastlines(resolution='50m')
ax.add_feature(ccrs.cartopy.feature.BORDERS, linestyle=':')
ax.add_feature(ccrs.cartopy.feature.STATES, linestyle=':')
margin = 0.1
ax.set_extent([np.min(lons_np) - margin, np.max(lons_np) + margin,
               np.min(lats_np) - margin, np.max(lats_np) + margin],
              crs=ccrs.PlateCarree())
ax.gridlines(draw_labels=True, dms=True, x_inline=False, y_inline=False)
ax.set_title("")
plt.show()
 
I didn't see anything with the python code. There might be something wrong in the intrinsic functions of wrf-python.
Can you contact unidata people to seek more information?
 
I didn't see anything with the python code. There might be something wrong in the intrinsic functions of wrf-python.
Can you contact unidata people to seek more information?
Is there any forum or contact info to address directly the issue?
 
Hello everyone,
For a while I have been using successfully wrf-python version 1.3.2.6, but recently a colleague of mine tried extractig cape_2d with wrf-python and found strange patterns in the map, the same happened with slp variable:
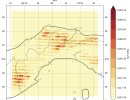
View attachment 15222View attachment 15221
However terrain variable (also extracted with wrf-python) seems fine:
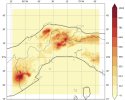
View attachment 15224

I have tried using his code to reproduce the results... but I couldn't! I got correct values, for example with CAPE:
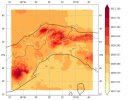
View attachment 15223
Does it make any sense? His version is the latest one, 1.3.4.1. The code to get the results is the following:

Code:
import numpy as np
import matplotlib.pyplot as plt
import cartopy.crs as ccrs
from netCDF4 import Dataset
from wrf import (getvar, interplevel, smooth2d, to_np, latlon_coords,
                 get_cartopy, cartopy_xlim, cartopy_ylim)
ncfile = Dataset("wrfout")
slp = getvar(ncfile, "slp")
cape_2d = getvar(ncfile, "cape_2d")
ter = getvar(ncfile, "ter")

mcape = cape_2d.isel(mcape_mcin_lcl_lfc=0)
lats, lons = latlon_coords(cape_2d)
lons_np = to_np(lons)
lats_np = to_np(lats)

var = mcape
var_np = to_np(var)
fig = plt.figure(figsize=(12,8))
ax = plt.axes(projection=ccrs.PlateCarree())
var_min = np.min(var_np)
var_max = np.max(var_np)
var_levels = np.linspace(var_min, var_max, 10)
var_levels = np.linspace(0, 3650, 10)
var_contours = ax.contourf(lons_np, lats_np, var_np,
                             levels=var_levels,
                             transform=ccrs.PlateCarree(),
                             cmap="YlOrRd", extend='both')
plt.colorbar(var_contours, label="")
ax.coastlines(resolution='50m')
ax.add_feature(ccrs.cartopy.feature.BORDERS, linestyle=':')
ax.add_feature(ccrs.cartopy.feature.STATES, linestyle=':')
margin = 0.1
ax.set_extent([np.min(lons_np) - margin, np.max(lons_np) + margin,
               np.min(lats_np) - margin, np.max(lats_np) + margin],
              crs=ccrs.PlateCarree())
ax.gridlines(draw_labels=True, dms=True, x_inline=False, y_inline=False)
ax.set_title("")
plt.show()
This is from netcdf4 module being the wrong version for WRF-python.

WRF-python hasn't been updated in a while and because of this newer packages of netcdf4 give these issues.

The version of netcdf that works for wrf-python is netcdf4 version 1.6.3
 
This is from netcdf4 module being the wrong version for WRF-python.

WRF-python hasn't been updated in a while and because of this newer packages of netcdf4 give these issues.

The version of netcdf that works for wrf-python is netcdf4 version 1.6.3
I encountered the same issue.I'm using version netcdf4=1.6.3, but the issue still hasn't been resolved.
 
We managed to solve the problem and it was an issue of libnetcdf version, we finally used:
libnetcdf v4.9.1
netcdf4 v1.6.3
wrf-python 1.3.4.1
 
Top