star_love_star
Member
Is there anyone use the Global 6-hourly Bias-corrected CMIP5 CESM data sets as WRF background field? I got the simulation results that the 2-m temperature in RCP4.5 scenario is higher than that in RCP8.5 in many years, but some years such as 2050 are normal.
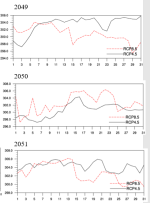
The line chart represents the daily temperature change in the years of 2049-2051, and it seems that only the simulation in 2050 is normal.
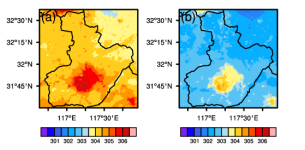
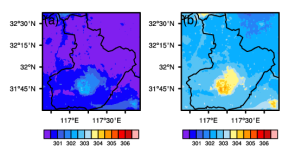
In the spatial distribution of 2-m temperature in 2050 and 2051, (a) represents RCP4.5 scenario and (b) represents RCP8.5 scenario. And the temperature of RCP8.5 in 2050 is higher than that in RCP4.5, but it is opposite in 2051.
I have no idea about this problem and hope someone could help. Thank you very much!
The line chart represents the daily temperature change in the years of 2049-2051, and it seems that only the simulation in 2050 is normal.
In the spatial distribution of 2-m temperature in 2050 and 2051, (a) represents RCP4.5 scenario and (b) represents RCP8.5 scenario. And the temperature of RCP8.5 in 2050 is higher than that in RCP4.5, but it is opposite in 2051.
I have no idea about this problem and hope someone could help. Thank you very much!