Hello,
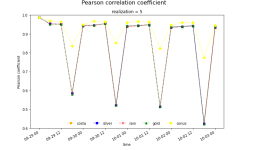
I am running a simulation using 5 different configurations and doing an analysis versus ERA5 reanalysis files. When calculating Pearson correlation coefficent over time, the get the output shown in the figure. I am calculating this value hourly during 4 days. I'm using GFS files as input data, in particular f000 until f096 for day 1 cycle 00.
Every 6 hours there's a large drop in the correlation that is corrected when the next cycle would start, but I'm not using multiple cycles so I don't understand why this is happening.
Does someone guess what is happening?

