Hello, I am testing restart files.
I ran a long simulation from time A to time B while saving restart files at time C and time D, with A<C<D<B, and saving the timeseries .TS files of the long simulation.
Then I ran simulations from the restart files at time C and at time D saving the .TS files.
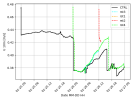
However, when I plot the variables (T2m, U10m, P) I find small differences (negligible for the surface pressure)...are these considered normal?
On WRF website it is mentioned that results of restart files should be identical!
These discrepancies I find are either at the beginning of the restart file, in the middle or at the end...and they normally converge with the original simulation.
I attached some plots. Orange and cyan are the same restart file run for 1hour or 12 hours respectively, and they overlap.
Thank you in advance for your help")
Have a nice day
Sam
I ran a long simulation from time A to time B while saving restart files at time C and time D, with A<C<D<B, and saving the timeseries .TS files of the long simulation.
Then I ran simulations from the restart files at time C and at time D saving the .TS files.
However, when I plot the variables (T2m, U10m, P) I find small differences (negligible for the surface pressure)...are these considered normal?
On WRF website it is mentioned that results of restart files should be identical!
It is effectively a continuous run made of two or more shorter runs; hence the results at the end of one or more restart runs should be identical to a single run without any restart.
These discrepancies I find are either at the beginning of the restart file, in the middle or at the end...and they normally converge with the original simulation.
I attached some plots. Orange and cyan are the same restart file run for 1hour or 12 hours respectively, and they overlap.
Thank you in advance for your help
Have a nice day
Sam