RCarpenter
Member
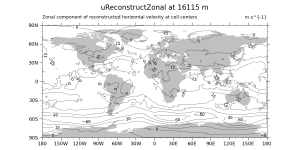
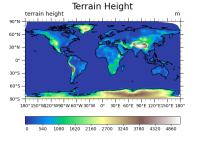
Has anyone used GeoCAT to plot MPAS on its native mesh? I know that capability exists in NCL, but I don't know if it has been ported to GeoCAT.
This post was from a previous version of the WRF&MPAS-A Support Forum. New replies have been disabled and if you have follow up questions related to this post, then please start a new thread from the forum home page.
import argparse
import sys

import numpy as np
from netCDF4 import Dataset
import cartopy.crs as ccrs

import matplotlib.pyplot as plt
import matplotlib.tri as tri

from scipy.spatial import Delaunay
import cartopy.feature as cfeature

from cartopy.mpl.gridliner import LongitudeFormatter, LatitudeFormatter

import geocat.viz as viz
import geocat.viz.util as gvutil


def normalize_coords(lat, lon):
    lat = np.rad2deg(lat)
    lon = np.rad2deg(lon)
    lon[lon > 180.0] -= 360
    return lat, lon

parser = argparse.ArgumentParser()
parser.add_argument('var', type=str, help="Desired variable to plot")
parser.add_argument('vlevel', type=int, help="Desired vertical level")
parser.add_argument('file',
                    type=str,
                    help='''File you want to plot from''')
args = parser.parse_args()

mesh = Dataset(args.file)
varName = args.var
vlevel = args.vlevel

var = mesh.variables[varName]
field = var[:]
field = field.squeeze()

latCell = mesh.variables['latCell'][:]
lonCell = mesh.variables['lonCell'][:]
zgrid = mesh.variables['zgrid'][:]
latCell, lonCell = normalize_coords(latCell, lonCell)

fig = plt.figure(figsize=(12,6))
ax = fig.add_subplot(1,1,1, projection=ccrs.PlateCarree())
# set_global() is currently needed for global plots. It seems Cartopy (or Matplotlib) currently has
# issues with setting the extent. See https://github.com/SciTools/cartopy/issues/1345
ax.set_global()
ax.add_feature(cfeature.LAND, color='silver')

gvutil.set_axes_limits_and_ticks(ax,
                                 xlim=(-180, 180),
                                 ylim=(-90, 90),
                                 xticks=np.linspace(-180,180,13),
                                 yticks=np.linspace(-90,90,7))

gvutil.add_major_minor_ticks(ax)
gvutil.add_lat_lon_ticklabels(ax)

ax.yaxis.set_major_formatter(LatitudeFormatter(degree_symbol=''))
ax.xaxis.set_major_formatter(LongitudeFormatter(degree_symbol=''))

gvutil.set_titles_and_labels(ax,
                             maintitle="{0} at {1:.0f} m".format(var.name, zgrid[0,vlevel]),
                             lefttitle=var.long_name,
                             lefttitlefontsize=13,
                             righttitle=var.units,
                             righttitlefontsize=13,
                             xlabel="",
                             ylabel="")

contour = ax.tricontour(lonCell, latCell, field[:,vlevel],
                        colors='black',
                        levels=7,
                        linewidths=0.5,
                        linestyles='-',
                        transform=ccrs.PlateCarree())

ax.clabel(contour, contour.levels, fontsize=12, fmt="%.0f")

plt.xticks(fontsize=14)
plt.yticks(fontsize=14)

plt.tight_layout()
plt.savefig('mpas_{0}_l{1}.png'.format(var.name, vlevel))
import sys

import numpy as np
from netCDF4 import Dataset
import cartopy.crs as ccrs

import matplotlib.pyplot as plt
import matplotlib.tri as tri

from scipy.spatial import Delaunay
import cartopy.feature as cfeature

from cartopy.mpl.gridliner import LongitudeFormatter, LatitudeFormatter

import geocat.viz as viz
import geocat.viz.util as gvutil


def normalize_coords(lat, lon):
    lat = np.rad2deg(lat)
    lon = np.rad2deg(lon)
    lon[lon > 180.0] -= 360
    return lat, lon

print('Argv[1]: ',sys.argv[1])
mesh = Dataset(sys.argv[1])

ter = mesh.variables['ter']
latCell = mesh.variables['latCell'][:]
lonCell = mesh.variables['lonCell'][:]
latCell, lonCell = normalize_coords(latCell, lonCell)

fig = plt.figure()
ax = fig.add_subplot(1,1,1, projection=ccrs.PlateCarree())
ax.set_global()
ax.coastlines()

gvutil.set_axes_limits_and_ticks(ax,
                                 xlim=(-180, 180),
                                 ylim=(-90, 90),
                                 xticks=np.linspace(-180,180,13),
                                 yticks=np.linspace(-90,90,7))

gvutil.add_major_minor_ticks(ax, labelsize=10)
gvutil.add_lat_lon_ticklabels(ax)

gvutil.set_titles_and_labels(ax,
                             maintitle="Terrain Height",
                             lefttitle=ter.long_name,
                             lefttitlefontsize=13,
                             righttitle=ter.units,
                             righttitlefontsize=13,
                             xlabel="",
                             ylabel="")

contour = ax.tricontourf(lonCell, latCell, ter[:],
                         levels=100,
                         cmap='terrain',
                         transform=ccrs.PlateCarree())

fig.colorbar(contour, orientation="horizontal")

plt.savefig('mpas_terrain.png')
