Hello,
I am running two domains over Greece d01 = 13.5km x 13.5 and d02 = 4.5 x 4.5 with GFS input data every 1h. I wanted to test the impact of observation nudging by incorporating wind speed & direction observations captured in wind farms. In total there are about 120 wind turbines in about 10 different locations (farms). I have managed to process the data using obsgrid.exe and run a 6 hour simulation twice. One without fdda and one with fdda to see the differences.
For the 6 hour simulation, I have provided observations every 15 minutes at each wind turbine location. Furthermore, I have used the modified metoa files generated by obsgrid as well as the wrfsfdda surface nudging input files, in my namelist.
The simulation runs without issues and WRF reports that it is able to read and process the observations. However, the end result at the wind turbine locations for these 6 hours is not very different between the two runs. Naively, I expected the run with observation nudging to follow the observations very closely, but it doesn't. Can someone give me a hint of what should I be expecting? Could it be that my observations are not well scattered over the domain or that they are very concentrated in just a few places? Is obsgrid.exe suited to "push" the simulation towards observations or not?
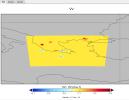
This is a difference plot of the VV variable between the two met_grid files, the one directly from GFS and the other one created by obrgrid, after it has ingested the observations. This is for hour 00 of the simulation. You can see the locations of the observations clearly. Similarly, the rest of the met_grid files are changed accordingly.

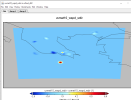
Here's a plot of the differences in forecasted wind speed between the two simulations at hour 00:

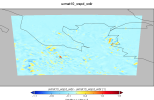
and another one at hour 06 of the simulation:

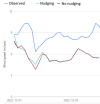
Finally here is a plot at a selected wind turbine location, with and without observation nudging, where you can see that there isn't much difference in the forecasted wind speed. This is for the complete 6 hour simulation. This is the part that I was expecting to see a lot different.

Here are my (most important) namelist input options:
&fdda
grid_fdda = 1, 1,
gfdda_interval_m = 60, 60,
gfdda_end_h = 5, 5,
gfdda_inname = "wrffdda_d<domain>",
io_form_gfdda = 2,
grid_sfdda = 1, 1,
sgfdda_inname = "wrfsfdda_d<domain>",
sgfdda_end_h = 5, 5,
sgfdda_interval_m = 60, 60,
io_form_sgfdda = 2,
obs_nudge_opt = 1, 1,
max_obs = 1500000,
fdda_start = 0,
fdda_end = 360,
rinblw = 50.,20.,
obs_nudge_wind = 1, 1,
obs_coef_wind = 0.0006,0.0012,
obs_nudge_temp = 0, 0,
obs_coef_temp = 6.E-3, 6.E-3,
obs_nudge_mois = 0, 0,
obs_coef_mois = 6.E-3, 6.E-3,
obs_rinxy = 50.,20.,
obs_rinsig = 0.1,
obs_twindo = 0.667, 0.667,
obs_npfi = 10,
obs_ionf = 15, 15,
obs_idynin = 0,
obs_dtramp = 360.,
obs_prt_freq = 10, 10,
obs_prt_max = 100
obs_ipf_errob = .true.
obs_ipf_nudob = .true.
obs_ipf_in4dob = .true.
obs_ipf_init = .true.,
the domain's time step is 60 seconds.
My gut feeling is that the momentum of the domain is very strong and the influence of the very few locations of the observations play a very insignificant role.
Thank you for any suggestions.
I am running two domains over Greece d01 = 13.5km x 13.5 and d02 = 4.5 x 4.5 with GFS input data every 1h. I wanted to test the impact of observation nudging by incorporating wind speed & direction observations captured in wind farms. In total there are about 120 wind turbines in about 10 different locations (farms). I have managed to process the data using obsgrid.exe and run a 6 hour simulation twice. One without fdda and one with fdda to see the differences.
For the 6 hour simulation, I have provided observations every 15 minutes at each wind turbine location. Furthermore, I have used the modified metoa files generated by obsgrid as well as the wrfsfdda surface nudging input files, in my namelist.
The simulation runs without issues and WRF reports that it is able to read and process the observations. However, the end result at the wind turbine locations for these 6 hours is not very different between the two runs. Naively, I expected the run with observation nudging to follow the observations very closely, but it doesn't. Can someone give me a hint of what should I be expecting? Could it be that my observations are not well scattered over the domain or that they are very concentrated in just a few places? Is obsgrid.exe suited to "push" the simulation towards observations or not?
This is a difference plot of the VV variable between the two met_grid files, the one directly from GFS and the other one created by obrgrid, after it has ingested the observations. This is for hour 00 of the simulation. You can see the locations of the observations clearly. Similarly, the rest of the met_grid files are changed accordingly.

Here's a plot of the differences in forecasted wind speed between the two simulations at hour 00:

and another one at hour 06 of the simulation:

Finally here is a plot at a selected wind turbine location, with and without observation nudging, where you can see that there isn't much difference in the forecasted wind speed. This is for the complete 6 hour simulation. This is the part that I was expecting to see a lot different.

Here are my (most important) namelist input options:
&fdda
grid_fdda = 1, 1,
gfdda_interval_m = 60, 60,
gfdda_end_h = 5, 5,
gfdda_inname = "wrffdda_d<domain>",
io_form_gfdda = 2,
grid_sfdda = 1, 1,
sgfdda_inname = "wrfsfdda_d<domain>",
sgfdda_end_h = 5, 5,
sgfdda_interval_m = 60, 60,
io_form_sgfdda = 2,
obs_nudge_opt = 1, 1,
max_obs = 1500000,
fdda_start = 0,
fdda_end = 360,
rinblw = 50.,20.,
obs_nudge_wind = 1, 1,
obs_coef_wind = 0.0006,0.0012,
obs_nudge_temp = 0, 0,
obs_coef_temp = 6.E-3, 6.E-3,
obs_nudge_mois = 0, 0,
obs_coef_mois = 6.E-3, 6.E-3,
obs_rinxy = 50.,20.,
obs_rinsig = 0.1,
obs_twindo = 0.667, 0.667,
obs_npfi = 10,
obs_ionf = 15, 15,
obs_idynin = 0,
obs_dtramp = 360.,
obs_prt_freq = 10, 10,
obs_prt_max = 100
obs_ipf_errob = .true.
obs_ipf_nudob = .true.
obs_ipf_in4dob = .true.
obs_ipf_init = .true.,
the domain's time step is 60 seconds.
My gut feeling is that the momentum of the domain is very strong and the influence of the very few locations of the observations play a very insignificant role.
Thank you for any suggestions.
Last edited:
