Scheduled Downtime
On Friday 21 April 2023 @ 5pm MT, this website will be down for maintenance and expected to return online the morning of 24 April 2023 at the latest

Stripes in wrf output finer than 1km

This post was from a previous version of the WRF&MPAS-A Support Forum. New replies have been disabled and if you have follow up questions related to this post, then please start a new thread from the forum home page.

slmeyer

New member
Dear WRF-Community,

at the moment I am trying to set up WRF up to a resolution of 40m. The simulation itself is running but looking at the results there might be still some problems.
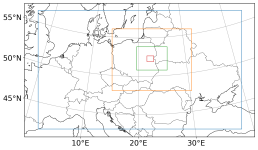
I first run D01-D04 (9km – 200m) in a single run and using this for running D05 using ndown with vertical refinement factor of 2, more details can be seen in the attached namelists.

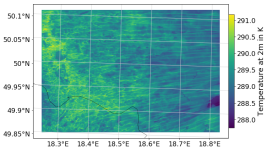
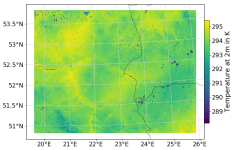
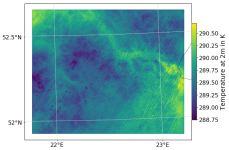
Looking at T2, Q2 and Wind in 10m height I am observing some kind of ‘stripes’ or wavelike structures as you can see for example for T2 in the attached image (07.06.2018, 7am, 2 hours after starting LES).
First guess was that the problems occur due to the high spatial resolution or the use of LES in this domain. But it showed up that these structures, but more broaden, also appear in my coarser domains, to be more precise they show up also in 1km and 200m case (3km and 9km seem to be ok), where I am not using LES (instead using Shin-Hong PBL). I already tried increasing vertical resolution as well as decreasing time step with no luck.
Does anyone has a hint what to try to get rid of these structures? If you need any further information about my set up do not hesitate to ask

Thanks a lot,
Sarah

P.S. I also look in this thread: http://forum.mmm.ucar.edu/phpBB3/viewtopic.php?f=58&t=5448 but I think the stripes in my case look a bit different and more 'wave like' so I think they are not created by the same reason? Also I am using WRF 4.1.1. and it seemed like this problem in Tians case occurred for <3.9.
 

Attachments

  • Image1.png
    Image1.png
    244.6 KB · Views: 2,358
Hi Sarah,
The namelist.input.D01-D04.txt file seems to only show 1 domain. Do you have the namelist that has all 4 of the initial run domains?
How far into the run do you start to see this pattern?
 
Hi,

oh seems like I took the namelists from my old WRF directory, sorry for this.
The right files are now attached to this post.

For T2 I see these patterns in my 200m domain starting from the second output, so 24.6. 01:00. For 1km domain it's harder to see but also clearly starts already on the first day but maybe later. I can definitly see them from 10:00 on that day.

Thanks,
Sarah
 

Attachments

  • namelist.input.d04-d05.txt
    8.7 KB · Views: 122
  • namelist.input.d05.txt
    7.4 KB · Views: 116
Hi,
When looking at your domain set-up, it looks like you have your domains too close to their parent domain, which could potentially be causing the problems you're seeing. d01 and d02 look good, but d03 is way too close to the edge of d02, and d04 is way too close to d03. Take a look at this page (specifically regarding i_parent_start and j_parent_start) for guidance on setting up a "good" domain:
namelist.wps Best Practices
 
Hi,

thank you for your tip regarding the domain position. I tested a new set up, where I shifted D04 and D03 more into the centre of their parent domain.

Looking at the T2 output I still can see this kind of stripes. In D04 I can see them in most cases, while in D03 it seem to be just present in a few time steps, but maybe this is due to the colour bar scaling.

Do you have another idea for me to test?

I am attaching a plot of my set up as well as the temperature at 2m for 24.6. (first day of simulation, but stripes also appear later) for D03 (10am) and D04 (6am)

Best Regards,
Sarah
 

Attachments

  • Stripes_d03.png
    Stripes_d03.png
    251.6 KB · Views: 2,315
  • Stripes_d04.png
    Stripes_d04.png
    263 KB · Views: 2,317
  • Domains_01_to_d04_shifted.png
    Domains_01_to_d04_shifted.png
    542.8 KB · Views: 2,316
Hi,
First, I would like to confirm this is a real-data case. I am not 100% sure because in your namelist, you set ztop=16000, which is only valid for ideal cases.
Second, In the first 4-domain run, when the resolution is increased to 200m, the vertical levels of 44 will not be appropriate for such a high horizontal resolution. Also, there is no consensus whether PBL scheme should be turned on or turned off at this resolution.
Third, please turn on the option diff_6th_opt =2, which will be helpful to reduce noisy signals.
We need to get rid of the noisy pattern in parent domain before we go on to child domain. Otherwise, the noise will be passed onto the child domain.
I would suggest you run a triply nested case, keeping all the physics options shown in your namelist.input.d04-d05. Then run ndown to creat initial and boundary condition for d04, run d04 with PBL on and off, and examine the output to make sure there are no stripes. Form there we can move on to d05, in which we need to turn off PBL and turn on diff_opt_6th.
Please let me know how the results look like.
 
Hi,

Ming Chen said:
Hi,
First, I would like to confirm this is a real-data case. I am not 100% sure because in your namelist, you set ztop=16000, which is only valid for ideal cases.
Yes it is a real-data case.

Second, In the first 4-domain run, when the resolution is increased to 200m, the vertical levels of 44 will not be appropriate for such a high horizontal resolution. Also, there is no consensus whether PBL scheme should be turned on or turned off at this resolution.
Increasing vertical levels I will test next. PBL turned off for my 200m domain has not worked in the past. Regarding recommendation I used bl_physics option 11 instead and added a smaller LES domain (see: https://forum.mmm.ucar.edu/phpBB3/viewtopic.php?f=40&t=607&sid=7035501586ff75ace84505b434fdeaa4). But I am planning to try this again.


Third, please turn on the option diff_6th_opt =2, which will be helpful to reduce noisy signals.
We need to get rid of the noisy pattern in parent domain before we go on to child domain. Otherwise, the noise will be passed onto the child domain.
I would suggest you run a triply nested case, keeping all the physics options shown in your namelist.input.d04-d05. Then run ndown to creat initial and boundary condition for d04, run d04 with PBL on and off, and examine the output to make sure there are no stripes. Form there we can move on to d05, in which we need to turn off PBL and turn on diff_opt_6th.
Please let me know how the results look like.
I am not sure if I should use diff_6th_opt =2 now in all my domains or just for my last/les domains?

I already tested a run of domain 1 to 3, removing ztop in my namelist and adding diff_6th_opt =2. I still do see this stripes in my T2 output.
As I understood the bl_physics option 11 I am using is recommended for horizontal resolutions inside this grey zone, so I also tried using option 5, since I just go up to 1km. This results in the same strange patterns in the T2 already in the 1km domain.

Thanks a lot
Sarah
 
Hi Sara.

Did you managed to sort out your stripes problem? I seem to encounter a similar problem. I guess that my problem comes from the initial boundary conditions, but I am not able to precisely pin point the cause.

Best regards,
aknnig
 
Dear aknnig,

sorry for this very late reply, I have not look into the forum for some time.
Unfortunately, if I remeber correctly, we were not able to solve the stripes problem.
You think it comes from the initia bpundary conditions, do you mean from the parent domain or the very intial boundary conditions so the meteo data used? If later were you also using ERA5 data for your case?

Best,
Sarah
 
Top