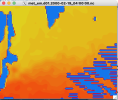
I am using ERA5 surface and pressure level data and the NOAA OI SST data for initialising the run. I have regridded the OI data onto the ERA5 grid, so as to match exactly, and have converted the netcdf files to grib using python cfgrib. However, I am getting some sort of artifact in the SST field. This is the Pacific, Japan is clear to the left, the artifacts are mainly lower right. APrt from this, the SST field looks to be correct. Attached is a screenshot of SST from a met_em file, generated using ERA5 surface and pressure level data and OI SST, interpolated to an ERA5 grid. I am not sure what is causing this.
artifacts when using a different SST dataset
- Thread starter rjhall
- Start date