beuraieon_a
Member
Hello everyone. I'm still a beginner in the WRF model, and I need your insights on how WRF's vortex-following mode actually works.
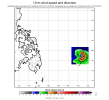
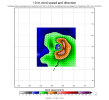
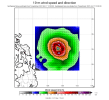
I recently tried running WRF with vortex-following for an intense Western North Pacific tropical cyclone. And I observed that while the automatically-moving nested domain did "automatically move" along with the cyclonic vortex, the nested domain remained stuck at its initial position when I visualized the WRF output using post-processing tools. I was expecting that the nested domain will "move across the map" along with the movement of the cyclonic vortex being tracked.
This is shown in the attached GIF animation of the WRF output for 10-meter wind speed and direction. I also attached my namelist files for your perusal. I opted to apply the default vortex-following settings, that's why their relevant variables (vortex_interval, max_vortex_speed, track_level etc.) are not present in the &domains section of my "namelist.input" file.
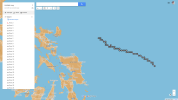
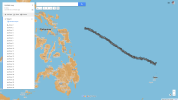
I tried simulating Typhoon Surigae (2021) around the time when it was at its peak intensity (simulation period: 12:00:00 UTC 2021 April 17 to 12:00:00 UTC 2021 April 18), using GFS analysis as input data. As you can see in the animation, the nested domain automatically moved along with Surigae's vortex, but it appears to be stuck at its initial position off the eastern coast of central Philippines. I thought that the nested domain will also appear to translate across the map or across its parent domain, in unison with Surigae's movement. Since Surigae was moving northwestward during the simulation period, the rough "outlines" of Eastern Visayas and Bicol Region can be observed near the end of the animation (in the southwest corner of the nested domain) when Surigae was at its closest approach towards the Philippines.
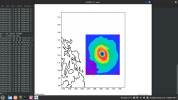
I used Panoply for the visualization in the attached GIF animation. I also tried visualizing the WRF output using GrADS, but I still observed the same behavior of the nested domain appearing stuck at initial position.
So I'm wondering: is this how WRF vortex-following really works? Or is there a tool, technique or strategy that can be applied so that the automatically-moving nested domain will also appear to automatically move or track across the map along with the vortex's movement?
Thank you very much in advance for your responses and recommendations.


