Scheduled Downtime
On Friday 21 April 2023 @ 5pm MT, this website will be down for maintenance and expected to return online the morning of 24 April 2023 at the latest

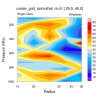
azimuthal averaged values of wrf outputs

wilfred kessy

New member
Greetings

I am studying tropical cyclone's structure using WRF. I am stuck on how to plot height-radius azimuthal averaged values of wrf outputs (Wind speed and diabatic heating).

kindly assist me with a script to plot these variables
 
Please see the attached script and png file. Hope it is helpful for you.
 

Attachments

  • azimuthal_avg.png
    azimuthal_avg.png
    200.8 KB · Views: 51
  • tst_polar.avg.ncl.txt
    6.3 KB · Views: 55
greetings Sir

This script is very useful thank you very much.

however, am struggling to extract wind data and put it into pressure levels at this part below. I don't know how to define the variable from the wrfout file so that it will have four dimensions as a bogus data (xx) is defined below. kindly help

xx = random_uniform(-8,100, (/ntim,nlev,Nlat,Nlon/)) ; data: rectilinear grid
xx!0 = "time"
xx!1 = "plev"
xx!2 = "lat"
xx!3 = "lon"
xx&time = time
xx&plev = plev
xx&lat = lat
xx&lon = lon
xx@long_name = "Bogus Data"
xx@units = "Whatever"
 
Top