Hi,
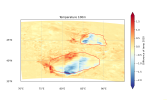
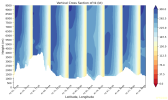
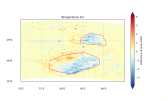
I'm using wrf-python to process wrfout data, but when I use the interplevel function to interpolate the temperature to 100m I get irregular changes, the several break lines(especially in the red polygon of first picture), and a similar problem with the vertical cross plot (second picture), but when I plot the 2m temperature, everything looks fine (third picture). So it seems like there is a problem when plotting with temperature variable with levels.
I appreciate it if someone know about it. Thank u so much!


