mgolbazi
New member
View attachment namelist.input Hi everyone!
I am trying to run WRF4.2 for 3 months of summer in 2018. My domain is 400*400 with a 4km resolution. Overall I have defined 56 vertical levels and I need 4 levels below 30 meters and one level at around 120 meters. I have used "dzstretch" options introduced in: https://forum.mmm.ucar.edu/phpBB3/viewtopic.php?f=40&t=10233
For input data, I am using the 12km NAM data from: https://www.ncdc.noaa.gov/data-access/model-data/model-datasets/north-american-mesoscale-forecast-system-nam
Problem: My runs keep crashing due to CFL error at random times and random gridcells. I understand that the CFL errors happen because the model becomes numerically unstable and a few solutions have been given in the forum like:
1. reducing the time step.
2. using the adaptive time step.
3. using "epssm" in the namelist.
4. using "smooth_cg_topo = .true." in the namelist.
Considering all this, I still get CFL errors randomly!
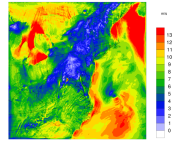
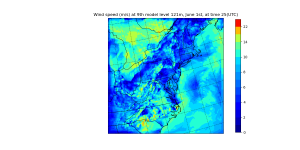
Another problem is, even though sometimes the runs do not crash for some simulation periods by using some of the solutions above, there are still streaks in my wind speed plots from the outputs. The streaks are so persistent. I have tried so many things and 3 kinds of input data (fnl, gfs, NAM) but they are still there. The streaks normally show up around times (14:00-23:00) in the first day of simulation and then (18:00 to 23:00) for the rest of the runs. I attached a plot to this post for your reference.
I doubted that the streaks are because of thin vertical layers close to the surface, so I ran a default simulation with the same number of vertical layers without thin layers close to the surface and streaks are still showing up in the output. Now, I am doubting that there is something wrong in my namelist that I cannot notice.
I also attached my namelist.input file for a successful run (no cfl errors) WITH streaks in the output.
I am stuck here and any suggestion would be very helpful!
Thank you!
 Hi everyone!
I am trying to run WRF4.2 for 3 months of summer in 2018. My domain is 400*400 with a 4km resolution. Overall I have defined 56 vertical levels and I need 4 levels below 30 meters and one level at around 120 meters. I have used "dzstretch" options introduced in: https://forum.mmm.ucar.edu/phpBB3/viewtopic.php?f=40&t=10233
For input data, I am using the 12km NAM data from: https://www.ncdc.noaa.gov/data-access/model-data/model-datasets/north-american-mesoscale-forecast-system-nam
Problem: My runs keep crashing due to CFL error at random times and random gridcells. I understand that the CFL errors happen because the model becomes numerically unstable and a few solutions have been given in the forum like:
1. reducing the time step.
2. using the adaptive time step.
3. using "epssm" in the namelist.
4. using "smooth_cg_topo = .true." in the namelist.
Considering all this, I still get CFL errors randomly!
Another problem is, even though sometimes the runs do not crash for some simulation periods by using some of the solutions above, there are still streaks in my wind speed plots from the outputs. The streaks are so persistent. I have tried so many things and 3 kinds of input data (fnl, gfs, NAM) but they are still there. The streaks normally show up around times (14:00-23:00) in the first day of simulation and then (18:00 to 23:00) for the rest of the runs. I attached a plot to this post for your reference.
I doubted that the streaks are because of thin vertical layers close to the surface, so I ran a default simulation with the same number of vertical layers without thin layers close to the surface and streaks are still showing up in the output. Now, I am doubting that there is something wrong in my namelist that I cannot notice.
I also attached my namelist.input file for a successful run (no cfl errors) WITH streaks in the output.
I am stuck here and any suggestion would be very helpful!
Thank you!

