Hello.
I successfully ran the WRF with data from the test ECMWF. I noticed that when I plotted the temperature at 2 m, there are cold spots on the coasts.
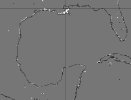
When I compared the Land-sea mask used by the geogrid and the one used by the ECMWF (Figure A, gray) I noticed that they are not compatible and the white dots show the location of the cold spots that you can see in Figure B. I was able to minimize them by changing the interpolation in METGRID.TBL, w_16 point average being the one that has worked best but not 100%.
Do you know of any tween that can help me minimize or fix the problem? or Any other ideas that could help me?
Regards
Alejandro
I successfully ran the WRF with data from the test ECMWF. I noticed that when I plotted the temperature at 2 m, there are cold spots on the coasts.
When I compared the Land-sea mask used by the geogrid and the one used by the ECMWF (Figure A, gray) I noticed that they are not compatible and the white dots show the location of the cold spots that you can see in Figure B. I was able to minimize them by changing the interpolation in METGRID.TBL, w_16 point average being the one that has worked best but not 100%.
Do you know of any tween that can help me minimize or fix the problem? or Any other ideas that could help me?
Regards
Alejandro