Greetings,
I have been investigating the performance of WRF w.r.t. different domain decomposition schemes (patches/tiles) in order to optimize for the turnaround time.
My approach is to reduce the number of patches on MPI level and to increase the number of tiles instead on OMP level. This should reduce the boundary data exchanged via MPI.
My expectation is that further decomposition of the patches into square tiles on OMP level should perform better than a 1D decomposition along the y axis. For two reasons:
First, we have better control to keep the data within caches when we do stencil accesses along all three axes.
Second, we reduce the additional data that each thread needs to access at the boundaries of the tiles by reducing the ratio of boundaries to inner points.
However, my benchmarks revealed the opposite. 1D decomposition performs significantly better than 2D square decomposition. I don't understand why this is the case.
To illustrate the point a series of benchmarks has been done. Our example has two domains, the first has 150x134x60 points, the second has 531x571x60 points.
I start 4 MPI ranks, one is pinned on each NUMA socket of a single node. WRF 4.3.1 was configured with "16", compiled with Intel compiler. MPI was Intel MPI. I selected one single OMP thread per rank. Depending on the benchmark this thread executes the tiles of each patch one after the other. No parallel execution of tiles within the same patch.
Domain one is executed every five executions of domain 2. Domain 2 dominates the runtime. We execute on a single cluster node with 2 AMD EPYC™ 7V73X (Milan-X) CPU, 512 GB RAM. The machine has 4 NUMA nodes 30 cores each, no hyper threading.
The tiling was done with 1D tiling along y-axis with 1,4,9,16,... tiles (still one thread per rank). And with 2D tiling along x/y axis 1, 2x2, 3x3, 4x4, ... (also single thread per rank). So the only difference between the two benchmark series is the order that the threads execute the data within each patch.
This setting excludes effects of OMP scheduling and false sharing between threads. It includes cache effects, TLB effects and overheads by loop pealing.
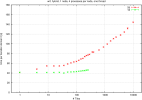
Plot 1 depicts the results. It plots the average runtime per iteration of domain1 (including 5 calls to domain2). We see that 1D tiling is performing always better than 2D tiling.
2D tiling gets significantly worse going from 1 to 2x2 and to 3x3. Beyond that we see a plateau. For very large numbers of tiles the runtime starts to raise again. We never see any positive cache effects by shrinking tiles.
1D tiling performs very constantly (always better than 2D) but gets worse for very high number of tiles. No visible negative cache effects or boundary effects caused by low extension of tiles in y direction.
Performance degradation for both 2D/1D tiles at high tile numbers should be caused by management overhead per tile.
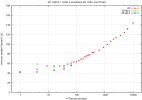
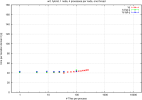
Seemingly shorter extension in x direction seems to degrade the performance very quickly, e.g. going from 260 points to 130 points. However I don't see respective performance degradation when I use more ranks with smaller patches which have shorter extension in x-direction too.
I would appreciate any hints concerning the reason why we see performance degradation of 2D tiling (but less for 2D patches).
Thanks in advance!


