William.Hatheway
Well-known member
Hello meteorologists and atmospheric scientists,
Over the years, I have developed a large collection of Python tools designed to highlight WRF’s capabilities for operational forecasting and real-world analysis. These scripts are intended to be freely shared with the community, especially for users with limited Python experience who still want access to high-resolution graphics, automation, batch processing, and a wide range of meteorological diagnostics.
All scripts are standardized across the collection, with consistent workflow, structure, and commenting style, making them easier to understand, adapt to new regions, and modify for custom use.
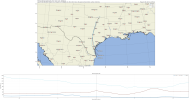
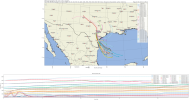
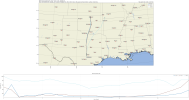
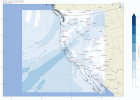
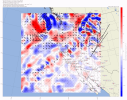
On my GitHub page, you will find a folder titled “Python Charts that work World.” It contains 93 Python scripts and 5 Bash shell scripts that generate a full suite of WRF-based graphics, including multicore execution options. The products span synoptic and mesoscale diagnostics, severe weather parameters, and simulated remote sensing. The goal is to provide a complete, automated, operational-ready post-processing package that converts raw WRF output into briefing-quality graphics with minimal user intervention.
GitHub profile:
GitHub - HathewayWill/WRF_Python_Scripts: synoptic/mesoscale, severe, clouds/moisture, precip/snow, fire weather, tropical, and point profiles. Supports Polar/Lat-Lon/Mercator/Lambert, multi-file outputs, and metric/imperial units. Open-source, free.!
The scripts are designed for the WRF-MOSIT Conda environment using wrf-python, but they can also run outside Conda if the following modules are installed:
numpy, matplotlib, metpy, wrf-python, netCDF4, pillow, scipy, cartopy, geopandas
All scripts support WRF’s native map projections, including Polar, Lat-Lon, Mercator, and Lambert. They are designed to work with common WRF output formats, including single files, multi-time files, or multiple wrfout files, without requiring users to reorganize output directories.
A major focus of this project is producing maps that are operationally useful immediately. The scripts include consistent Cartopy-based geographic features such as coastlines, borders, water bodies, land–ocean contrast, gridlines, and optional terrain context. Styling is standardized so line weights, labels, and backgrounds remain consistent across products.
Many scripts include automated city and location labeling to improve situational awareness for forecasting and briefing use. Placement is optimized to minimize overlap with meteorological fields.
The plotting logic is designed to work anywhere in the world, allowing the same workflow to be used for domains over any region. Metric and Imperial versions of many diagnostics are included, so users can run identical products without modifying unit conversions.
The collection includes products in the following areas:
• Upper-air and synoptic diagnostics
• Moisture, cloud, and column fields
• Convective and severe weather parameters
• Surface analysis and human-impact indices
• Precipitation, snowfall, and SWE accumulations
• Simulated radar-style products
• Fire weather indices
• Point-based forecasts, vertical profiles, and cross sections
• Tropical surface diagnostics
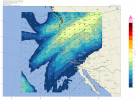
Five Bash shell scripts automate execution by activating environments, locating WRF output, creating date-stamped directories, and running full chart suites across domains, including optional parallel processing. A complete forecast graphics package can be generated in a single run.
The goal of this project is to lower the barrier to producing high-quality WRF post-processing graphics. Users new to Python can run a full operational suite with minimal setup, while experienced users can treat the scripts as a standardized framework for adding additional diagnostics.
I hope this resource is useful to the community.
More information available here: WRF-Python Codes for the Weather Research and Forecasting Model
Over the years, I have developed a large collection of Python tools designed to highlight WRF’s capabilities for operational forecasting and real-world analysis. These scripts are intended to be freely shared with the community, especially for users with limited Python experience who still want access to high-resolution graphics, automation, batch processing, and a wide range of meteorological diagnostics.
All scripts are standardized across the collection, with consistent workflow, structure, and commenting style, making them easier to understand, adapt to new regions, and modify for custom use.
On my GitHub page, you will find a folder titled “Python Charts that work World.” It contains 93 Python scripts and 5 Bash shell scripts that generate a full suite of WRF-based graphics, including multicore execution options. The products span synoptic and mesoscale diagnostics, severe weather parameters, and simulated remote sensing. The goal is to provide a complete, automated, operational-ready post-processing package that converts raw WRF output into briefing-quality graphics with minimal user intervention.
GitHub profile:
GitHub - HathewayWill/WRF_Python_Scripts: synoptic/mesoscale, severe, clouds/moisture, precip/snow, fire weather, tropical, and point profiles. Supports Polar/Lat-Lon/Mercator/Lambert, multi-file outputs, and metric/imperial units. Open-source, free.!
Compatibility and installation
The scripts are designed for the WRF-MOSIT Conda environment using wrf-python, but they can also run outside Conda if the following modules are installed:
numpy, matplotlib, metpy, wrf-python, netCDF4, pillow, scipy, cartopy, geopandas
Map projections and WRF output handling
All scripts support WRF’s native map projections, including Polar, Lat-Lon, Mercator, and Lambert. They are designed to work with common WRF output formats, including single files, multi-time files, or multiple wrfout files, without requiring users to reorganize output directories.
Geographic context and operational styling
A major focus of this project is producing maps that are operationally useful immediately. The scripts include consistent Cartopy-based geographic features such as coastlines, borders, water bodies, land–ocean contrast, gridlines, and optional terrain context. Styling is standardized so line weights, labels, and backgrounds remain consistent across products.
Many scripts include automated city and location labeling to improve situational awareness for forecasting and briefing use. Placement is optimized to minimize overlap with meteorological fields.
Global design and unit support
The plotting logic is designed to work anywhere in the world, allowing the same workflow to be used for domains over any region. Metric and Imperial versions of many diagnostics are included, so users can run identical products without modifying unit conversions.
Script categories
The collection includes products in the following areas:
• Upper-air and synoptic diagnostics
• Moisture, cloud, and column fields
• Convective and severe weather parameters
• Surface analysis and human-impact indices
• Precipitation, snowfall, and SWE accumulations
• Simulated radar-style products
• Fire weather indices
• Point-based forecasts, vertical profiles, and cross sections
• Tropical surface diagnostics
Automation
Five Bash shell scripts automate execution by activating environments, locating WRF output, creating date-stamped directories, and running full chart suites across domains, including optional parallel processing. A complete forecast graphics package can be generated in a single run.
Purpose
The goal of this project is to lower the barrier to producing high-quality WRF post-processing graphics. Users new to Python can run a full operational suite with minimal setup, while experienced users can treat the scripts as a standardized framework for adding additional diagnostics.
I hope this resource is useful to the community.
More information available here: WRF-Python Codes for the Weather Research and Forecasting Model