Dear all,
I need to modify WRF green vegetation fraction file for January 2021. So, I calculated NDVI for each month of the year 2021 and then applied the below equation to compute the green vegetation fraction :
GVF = (NDVI-NDVImin)/(NDVImax -NDVImin)
NDVImin ------> minimum value between 12 months of the year 2021
NDVImax ------> maximum value between 12 months of the year 2121
NDVI -------> NDVI value for month January 2021
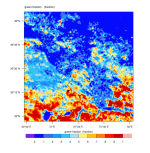
After passing all these steps, the result was weird!
In some areas there are overestimations. I wonder where I did a mistake? Please kindly advise me in this regard.
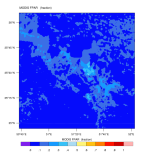
The output and model default files are attached.
Thanks in advance,
Kind regards,
I need to modify WRF green vegetation fraction file for January 2021. So, I calculated NDVI for each month of the year 2021 and then applied the below equation to compute the green vegetation fraction :
GVF = (NDVI-NDVImin)/(NDVImax -NDVImin)
NDVImin ------> minimum value between 12 months of the year 2021
NDVImax ------> maximum value between 12 months of the year 2121
NDVI -------> NDVI value for month January 2021
After passing all these steps, the result was weird!
In some areas there are overestimations. I wonder where I did a mistake? Please kindly advise me in this regard.
The output and model default files are attached.
Thanks in advance,
Kind regards,