Scheduled Downtime
On Friday 21 April 2023 @ 5pm MT, this website will be down for maintenance and expected to return online the morning of 24 April 2023 at the latest

High Resolution SST and problems with METGRID

mughalo

New member
Hi All

I have been trying to use a High Res data set of SST in WPS. I have successfully converted the data from the netcdf format to grib2 and was able to use it to generate the required intermediate files for METGRID. The data downloaded from RDA website is available in 6 hourly format and has time stamps with a 6 hour interval. The SST files on the other hand have a 24 hour interval and have a format as 2018-01-13_15. This causes a date issue between the two files as:

SST:2018-01-13_15
SST:2018-01-14_15
SST:2018-01-15_15

FILE:2018-01-13_00
FILE:2018-01-14_00
FILE:2018-01-15_00

and although I use different prefixes for metgrid, I am not able to ingest the SST data in in the metgrid files. I will be grateful if someone can help me solve this issue.

Regards

Omer
 
Hi Omer,
When you set up namelist.wps for running ungrib on your SST data, try using the same interval_seconds you used for running your atmospheric data. Although the sst files are spaced at a larger interval, WPS will interpolate them to the same interval as your atmospheric data.
 
Hi
Thanks for the reply. Your suggestion fixed the error. However, I am getting unreasonable values in some regions such as 217 K. With the ERA 5 data this error was fixed by modifying the interpolation method in the METGRID.TBL file as follows

interp_option=sixteen_pt+four_pt+wt_average_4pt+search
missing_value=-1e+30
interp_mask=LANDSEA(1)
masked=land
fill_missing=0.
flag_in_output=FLAG_SST

However, using the same method in my case does not work and I get a segmentation fault. I will be grateful for your response.
 
I'm happy to hear that resolved your original issue. Are you seeing these original values after running wrf.exe? If so, do you mind posting a new thread with the new problem? That makes topics easier to search for us and other users in the future. If you're seeing the issues after running metgrid.exe, can you send me your namelist.wps file, METGRID.TBL, and a couple of our input data files (both atmospheric and sst) so I can try to repeat the issue? If the files are too large to attach here, and if you don't have another method for sharing the files, take a look at the home page of this forum which discusses sharing large files. Thanks!
 
Hi Thanks again for the prompt response. The issue is at the metgrid stage. I have uploaded the intermediate files generated by Ungrib, namelist.wps and METGRID.TBL for convenience on next cloud via this link. The folder is called SST_ISSUE_METGRID.tar
 
Thanks for uploading those files. It was very helpful. I believe something is wrong with the SST data, though it's difficult to say what the issue is. I tried to plot the intermediate files using the NCL program with the "plotfmt.ncl" script available in WPS/util. When I plot the FILE* input data files, all is well, but when I plot the SST* input files, I get several errors like this:

Code:
(0)    gsn_add_cyclic: Warning: The range of your longitude data is not 360.
(0)    You may want to set the gsnAddCyclic resource to False to avoid a
(0)    warning message from the spline function.
warning:_NhlCreateSplineCoordApprox: Attempt to create spline approximation for X axis failed: consider adjusting trXTensionF value
warning:IrTransInitialize: error creating spline approximation for trXCoordPoints; defaulting to linear
warning:ContourPlotDraw: out of range coordinates encountered; standard AreaFill rendering method may be unreliable;
 consider setting the resource trGridType to "TriangularMesh" if coordinates contain missing values
fatal:ContourPlotDraw: Workspace reallocation would exceed maximum size 100000000
fatal:ContourPlotDraw: draw error
fatal:PlotManagerDraw: error in plot draw
fatal:_NhlPlotManagerDraw: Draw error

Could the issue be that the SST data projection doesn't line up with the other projection for the atmospheric data? I see the warning that they data do not extend a full 360 degrees longitudinally. Is the SST data just a subset of data (and not global)?
 
Hi
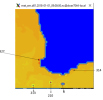
Thanks so much for spending time on the data files that I sent. The data is a subset over Australia, but the major problem was that the clouds were not masked out from the final product and the value of zero was assigned to both land and the clouds in the data. I found a work around by using a 3-day average of the data which seems to be much better than this data set however there are still few areas in the data which are giving unreasonable values shown in the attached image. I am using NCL to remove these unreasonable values but the area where there is 0 value in the middle and higher values in the vicinity is the most problematic one.
 

Attachments

  • WRF_forum.png
    WRF_forum.png
    29.4 KB · Views: 10
Top