Hi,
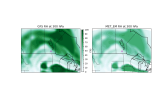
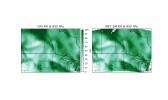
Out of curiosity, I looked into the RH (relative humidity) field in my GFS analysis data (the 0.5 deg GFS analysis) and compared that with the RH field in my met_em file processed by WPS, at the same time. I found that at higher pressure levels (i.e., closer to the ground), the RH in my met_em is fairly consistent with the GFS analysis RH (a figure showing the 850 hPa RH from the GFS analysis and met_em is attached. The 'RH_P0_L100_GLL0' variable from my GFS analysis file, after converting from grb2 to netCDF, is plotted). However, as I go higher in the atmosphere, the met_em RH becomes significantly smaller than the GFS analysis RH at the same pressure level (a figure showing the RH at 300 hPa from the GFS analysis and met_em is also attached). What is the reason behind this change?
Another strange thing I found is that in my GFS analysis data, there is no point with a negative (<0%) RH nor a point with RH > 100%. However, in my met_em, I found a few points with slightly negative RH (as low as -3%) and a few with RH slightly greater than 100% (as large as 101%). Is this normal? The slightly negative RH worries me a bit as that doesn't really make sense.
Thanks,
David
") ,
,