Hi,
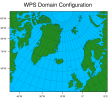
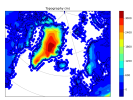
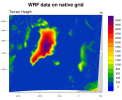
The WPS domain I get when using plotgrids_new.ncl and plotgrids_old.ncl (see "WPS_50km.png" attached) is somewhat different from the domain of my WRF output (see "WRF_50km.png" attached). I used wrf python to plot the simulation output. I have also plotted the data with ncl (see "WRFplot_tfDoNDCOverlay_False" attached), using wrf_map_resources and gsn_csm_contour_map. In this latter image, the map domain is similar to that of WPS, but the domain covered by the output is not the same, so I am confused...
In my WRF and WPS namelists, e_we, e_sn, dx and dy are the same. Shouldn't the WRF domain be exactly the same as the WPS domain?
Thanks in advance,
Marta