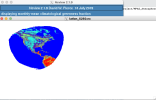
I started with the 60–3 km circular mesh and used the Limited-Area tool to extract a subdomain: a circular region with radius 5250 km (also tested up to 6000 km), chosen to fully enclose the refinement area.
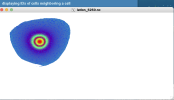
Using ncvis on the cut-out static file showed boundary artifacts in the landmask, but this is likely just an ncvis interpolation issue. Converting the static file to a Cartesian grid, and plotting with ncview, with convert-mpas resolved the landmask and other variable problems.
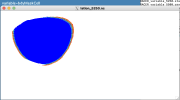
However, I wanted to confirm something:
- Some data appear missing along the southern edge, particularly in bdyMaskCell.
- ncview reports: 710 missing values were eliminated along axis "longitude".
- Is this just an issue of ncview ignoring some values and the grid is really fine?
Using ncvis on the cut-out static file showed boundary artifacts in the landmask, but this is likely just an ncvis interpolation issue. Converting the static file to a Cartesian grid, and plotting with ncview, with convert-mpas resolved the landmask and other variable problems.
However, I wanted to confirm something:
- Some data appear missing along the southern edge, particularly in bdyMaskCell.
- ncview reports: 710 missing values were eliminated along axis "longitude".
- Is this just an issue of ncview ignoring some values and the grid is really fine?