Hi all,
I am currently having an issue with the met_em* files generated by metgrid.exe
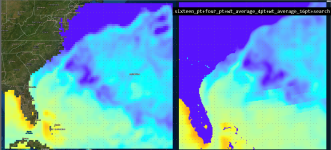
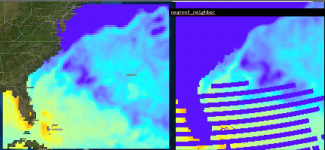
I am interpolating the SST (from ERA5) to my domain but I am seeing some interpolation artifacts that I can't explain.
I played with the options in METGRID.TBL.
First try was:

Second try:
Left panel is the source data used: ERA5 grib file. Plots are SST in K color range: 300-305K

can you please advise me on what may be wrong here?
Cheers
I am currently having an issue with the met_em* files generated by metgrid.exe
I am interpolating the SST (from ERA5) to my domain but I am seeing some interpolation artifacts that I can't explain.
I played with the options in METGRID.TBL.
First try was:
Code:
name=SST
        interp_option=sixteen_pt+four_pt+wt_average_4pt+wt_average_16pt+search
        masked=land
        interp_mask=LANDSEA(1)
        missing_value=-1.E30
        fill_missing=0.
        flag_in_output=FLAG_SST
Second try:
Code:
name=SST
        interp_option=nearest_neighbor
        masked=land
        interp_mask=LANDSEA(1)
        missing_value=-1.E30
        fill_missing=0.
        flag_in_output=FLAG_SST
Left panel is the source data used: ERA5 grib file. Plots are SST in K color range: 300-305K

can you please advise me on what may be wrong here?
Cheers
