Scheduled Downtime
On Friday 21 April 2023 @ 5pm MT, this website will be down for maintenance and expected to return online the morning of 24 April 2023 at the latest

MPAS-A predicted precipitation is underestimated

bgrasic

New member
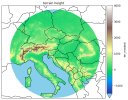
I am running on a daily base MPAS-A model version 8.2.2 using limited area. Selected domain is presented on the first figure. It has radius of 900 km with the centre in Slovenia and resolution of cells is 10 km. I am using default config_physics_suite = 'mesoscale_reference'.

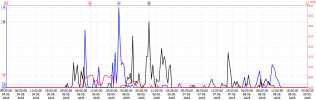
On the second figure is a graph of measured and predicted precipitation for the last week period for the location in the centre of the domain where I have available measurements on half-hour time resolution:
red curve - predicted precipitation by MPAS-A (sum of rainnc and rainc variables)
black curve - predicted precipitation by WRF
blue curve - measured precipitation

Comparision of the results shows underestimated precipiation for MPAS-A model. I also tried the "convection_permitting", but there I got no precipitation where I guess that the problem is not enough fine resolution. I was also playing with other convection schemes but got even less precipitation.

Is there some problem in my configuration files? Can I maybe turn on some additional debugging information?
I can provide also listing of simulation configuration settings.

I look forward for any suggestions,
Boštjan
 

Attachments

  • Krsko10kmR900km_terrain.png
    Krsko10kmR900km_terrain.png
    333.9 KB · Views: 9
  • precipitation_center_v01.png
    precipitation_center_v01.png
    75.6 KB · Views: 9
Hi Boštjan,
Would you please give me more details regarding your case:
(1) what data did you use to provide initial and boundary conditions for this case?
(2) what global mpas mesh did you use to create your regional mesh?
(3) please clarify step-by-step how you set up and run this case.
(4) Can you upload your namelist and streams files for me to take a look?
Thanks!
 
Hello,

thank you for your response. Here are some details about my case:
(1) for initial and boundary conditions I used for my case GFS data. Log files from ugrib and init_atmospere are attached and
I hope they describe well enough how initial and boundary conditions are prepared.
(2) I downloaded 60-km – 10-km mesh (x6.999426.grid.nc) for creating my regional mesh.
(3) I hope provided log files in the attachment include enough information how I setup and run my case. Please let me
know if you need additional information. I am usings scripts to create and run model, if needed, I will provide them.
(4) There are also namelist and streams files attached for both init_atmosphere and atmosphere.

Bye,
Boštjan
 

Attachments

  • MPAS-A_debug_precipitation.zip
    135.6 KB · Views: 3
Hi, Boštjan

Thank you for uploading your files. I will take a look and get back to you.

It may take some time and I appreciate your patience.

Ming
 
One more question:

The time series of precip of OBS, WRF and MPAS are for a single point or domain-averaged? If it is for a single point, how did you interpolate MPAS (and WRF) data to the specific point?
 
Thank you again for taking your time for my case.

Time series for all three curves (OBS, WRF and MPAS) on the graph are for a single point.

WRF and MPAS values are calculated from the variables RAINC and RAINNC as a difference between current halfhour value at time T and previous halfour value at T-30min: PRECIP = (RAINC(T)+RAINNNC(T))-(RAINC(T-30min)+RAINNC(T-30min)).

MPAS value for a single point are taken as a value from a cell where point in located.
WRF values for a single point are interpolated from 4 nearest cells.
 
Hi, Boštjan

I am writing to tell that I didn't forget your issue. I can repeat the problem but don't know yet how to fix it.

Our HPC is pretty busy and I have to wait in the queue for my job to get started.

I definitely will get back to you for any update and progress. Thank you for your patience.
 
Hello,

there is absolutely no rush on my part. I can easily wait as long as it takes. I am very grateful that you took the time to look into our problem.

Best regards, Boštjan
 
Hi, Boštjan,

All your namelist and streams files look fine to me. GFS ungrib also looks good.

I have run a test case over CONUS, using GFS as the forcing data. This is a winter storm case, and I run both WRF and MPAS for 72-hour.

Please see the attached plot that shows accumulated precipitation, --- WRF and MPAS yield similar results. Note that this is a 15-km resolution run, and I did this because I want to run a relatively simple case simply to confirm that MPAS could work as expected.

I am perplexed why your case showed such a severe precipitation underestimation. Would you please upload the following files for me to take a look:

(1) a single LBC file, --- I would like to see whether moisture field is normal in the lateral forcing
(2) a single mpas output file that contains rainc and rainnc and a single wrfout file at the same output time

Thank you.
 

Attachments

  • test.pdf
    389.1 KB · Views: 5
Hello,

Thank you for your case, everything look good, so there really might be problem in my input files.

I have prepared you some files on our website to download. There is some short case for today's afternoon precipitations in mountainous part of Slovenia. It might not be perfect case, but so far I have available only online data. Zip file is large because I put there WRF and MPAS outputs as well as LBC files, init file and static file. I hope this is ok with you, otherwise I can split files.


For the future if needed I can select some episode for some other period that is more characteristic for precipitations.

Regards,
Boštjan
 
I am posting again regarding my problem of underestimated precipitation. In the meantime, I have upgraded the MPAS model to the latest version 8.3.1 and it works much better now, but the problem of underestimated precipitation still remains. Below I have pasted another example of the predicted precipitation for tomorrow in central Europe. The first result is MPAS, which has higher values only on the narrow edge of the domain, and the second result is from the WRF model.

I am wondering if you have managed to check my problem yet?

Greetings, Boštjan


1755704371569.png

1755704329197.png
 
Hi Boštjan,

We did fix a bug in MPAS that leads to extremely low precipitation. However, this bug shouldn't affect MPAS run driven by GFS. I suppose your issue could be attributed to other reasons.

Please tell me what data did you use to drive the regional MPAS and WRF simulations?

Can you send me the following files :

(1) namelist.input for grid-rotation

(2) namelist.init_atmosphere

(3) namelist.atmosphere

Hopefully I can repeat your case with the same issue. Then we can further explore what is the reason behind.
 
I am sending you requested files in attachment. I hope we can find the problem.
My regional domain was created from x6.999426.grid.nc.

Regards,
Boštjan
 

Attachments

  • MPAS_debug2.zip
    4.4 KB · Views: 1
Hi Boštjan

Thank you for uploading these files. I will look at this case and get back to you as soon as possible.

Regards,
 
Hi Boštjan,

I have repeated your case using your namelist.init_atmopshere and namelist.atmopshere. But I change the model top to 30km (config_ztop = 30000.0).

I run this case using GFS to produce initial and boundary conditions. The plot below shows 24-hr precipitation ending at 2025-08-21_18.00.00.

The model performs as expected and I did get abundant precipitation.

For your case with almost zero precip, I notice that in your namelist.init_atmopshere.initial, you set "config_nfglevels = 38", but your input data is GFS ( indicated by "config_met_prefix = 'GFS" ). I know that GFS only has 34 levels while ERA5 has 38 levels. Is it possible that you mixed GFS with ERA5 and somehow the model yielded weird output?

Would you please rerun your case and pay attention to the following two issues:

(1) make sure you run with GFS as input

(2) change the model top to 30km

Please keep me updated about your results.


1757539524641.png
 
Hello Ming,

I am sorry for delayed answer because I did not follow the forum recently and also did not get notification to my email.

Your result is great, it gives me hope that I can slowly reach my goal. I changed both recomended settings today.
On the first sight seems that change to 34 levels improved my results, especially on the boundary cells.
While change of model top to 30 km gives me simulation errors.

It seems to me that I have problems with initialization. Is there possible that you can send my your settings?
Maybe I do something wrong with ungrib?
I am sending you log files and settings from my unsucessful run.

I use real-time GFS forecasts from the website address:

Thank you again for your effort.

Regards, Boštjan
 

Attachments

  • MPAS_debug3.zip
    29 KB · Views: 0
Hi Boštjan,

I agree that your problem may be attributed to wrong input data, including both initial and lateral boundary conditions.

Can you download GFS data from NCAR archive (NSF NCAR GDEX Dataset d084001), then ungrib these GFS files following the standard WPS method? I am not sure of the data structure posted in NOAA, and any issues in those NOAA data may lead to wrong model behavior.

When you rerun your case, please set model top to 30km, then rerun init_atmosphere to produce initial and boundary conditions.

I am sorry that I didn't save namelist and streams files for your case, ---- I need to do various simulations almost every day and I don't have resources to save all the files, especially those related to users' cases. Typically I just delete all files related to users' cases once the problem is fixed because I need to spare spaces for other work.

Please try and keep me updated about your results. Let me know if you still have any issues. Thanks.

Ming
 
Thank you for your instructions.

I have succesfully repeated simulation with data from NCAR archive for 21.08.2025 and I got very good results.
I even did not get errors with ztop set to 30km.

It seems that the real-time data forecasts that I am taking from NOAA is not appropriately set up.
Is it possilble to improve this or should we getting real-time forecast from some other repositories?
Can you suggest some?

Here are my results of precipitation rate at the end of simulation.

Boštjan

1758294527360.png
 
Hi Boštjan,

Thank you for the update. I am glad it works for you !

If you need to run real-time forecast, I guess you have to get data from NOAA. Please contact NOAA and tell them what variables you need.

Unfortunately NCAR archive is always lagged behind a few days.

Ming
 
Hello Ming!

Thanks for all the help so far. I have an additional question when repeating the example of 21.8.2025. The precipitation intensity is much better with the GFS reanalysis data. However, a comparison with the WRF results of that day shows that the precipitation moved over Slovenia significantly faster than the MPAS-A model results show. In general, the simulations look like the air masses are moving relatively slowly over central Europe. From a feeling, I would say that it looks like the initial conditions are well taken into account in the simulation, and the boundary conditions have less influence. Is it possible to get some MPAS model results for central Europe somewhere that I could compare my results with?

Regards, Boštjan
 
Top