Snow_Rain_Cloud
New member
Dear technical support,
I configured a set of experiments to look at SST differences between two experiments with config_sst_update = true and false.
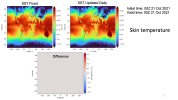
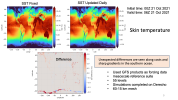
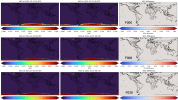
Please find attached figure F000_sst.png the skintemp difference in one run initialized at 00Z 21 Oct 2021. The second figure, F006_sst.png is the same run but for a 6-h forecast. The differences along the coast and sharp gradients seem to appear, when SST has not been updated yet - which will happen at f024.
Do you have any ideas on why this happens? Apologies for the poor figure quality and colors – our server is under maintenance so I cannot re-create plots.
I am using 60-15 km meshes, 55 levels, mesoscale reference suite, and version 8.2.2.
Thanks so much for your time!
Minghua
I configured a set of experiments to look at SST differences between two experiments with config_sst_update = true and false.
Please find attached figure F000_sst.png the skintemp difference in one run initialized at 00Z 21 Oct 2021. The second figure, F006_sst.png is the same run but for a 6-h forecast. The differences along the coast and sharp gradients seem to appear, when SST has not been updated yet - which will happen at f024.
Do you have any ideas on why this happens? Apologies for the poor figure quality and colors – our server is under maintenance so I cannot re-create plots.
I am using 60-15 km meshes, 55 levels, mesoscale reference suite, and version 8.2.2.
Thanks so much for your time!
Minghua