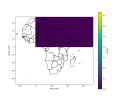
Please assist I am trying to do some simulations over SADC region. now this is more of a benchmark case before i start the actual WRF run. so appears that my domain is focused on the Northeastern parts of Africa but this is contrary to the namelists attached. I will attach the python script I am using to extract the above.. please assist as its been 2 months now trying to sort this issue.
PYTHON SCRIPT
plt.savefig('rainfall_plot_J10.png')
PYTHON SCRIPT
import xarray as xr
import matplotlib.pyplot as plt
import geopandas as gpd
# Open the NetCDF file using xarray
file_pattern = '/home/wrf/Build_WRF/WRF/run/wrfout_d01_2022-12-25_*00:00'
# Open and combine the NetCDF files using xarray
combined_data = xr.open_mfdataset(file_pattern, combine='nested', concat_dim='Time')
# Access the "RAINC" variable
rainc_var = combined_data['RAINC']
# Compute the cumulative sum along the time dimension
cumulative_rainc = rainc_var.sum(dim='Time')
# Load the administrative boundaries shapefile using geopandas
admin_boundaries = gpd.read_file('/home/wrf/Build_WRF/WRF/run/SHP/NationalBnds.shp')
# Plot the cumulative map and shapefile
fig, ax = plt.subplots(figsize=(10, 8))
cumulative_rainc.plot(ax=ax)
admin_boundaries.plot(ax=ax, facecolor='none', edgecolor='black')
# Adjust plot extent
xmin, ymin, xmax, ymax = admin_boundaries.total_bounds
ax.set_xlim(xmin, xmax)
ax.set_ylim(ymin, ymax)
# Save the plot to a file
plt.savefig('rainfall_plot_J10.png')
I have attached the ideal map projection thatI want. Please assist
Attachments

Last edited: