Hi all,
TL;DR
There are some really long solution times (greater than 100s) that occur at regular 5-hour intervals that don't seem to be associated with I/O and I can't figure out how—or if—I can decrease them. Throwing more CPUs has only shaved a few seconds off each time-step.
Background
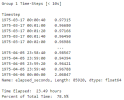
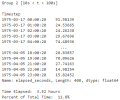
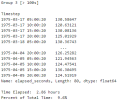
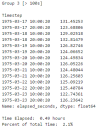
I have a 20-day nested 4-km/1-km simulation for the Southeastern US and noticed that time-steps can be generally sorted into 3 categories based on the wall-time required for a solution:
Group 1 solution times coincide with time-steps occurring between data ingestion periods (micro-physics, radiation, etc.), Group 2 solution times are associated with time-steps that coincide with the hourly input data intervals, and Group 3 solution times occur every 5 hours on the first time-step of the hour, but the pattern resets on the following day (e.g. 1975-03-17 05:00:20, 1975-03-17 10:00:20, 1975-03-17 15:00:20, 1975-03-17 20:00:20, 1975-03-18 05:00:20, etc.). Given that I'm running this model for a total of about 45 years of simulation time in 20-day chunks, if I can save 4-6 (2-3 per domain) hours per run that would save me several weeks-worth of wall-time overall.
To this end, I had aimed some tests at scaling CPUs to try to decrease my wall-time, but have so far been largely unsuccessful in achieving appreciable reductions in the latter group associated with the 5-hourly interval which has me wondering if there is something else going on in the model at these times that is separate and apart from computations that is causing this. Some of the relevant processes in the model include nudging which occurs every 3 hours in domain 1 and not in domain 2, history output is hourly, and input interval is hourly. I/O should not be a bottleneck as I'm working with a brand new machine that has a Lustre file system (75 GB/s read and write with 12 OSTs) and quilting enabled using 120 CPUs. I've looked at the radiation scheme time-steps and these are all very short (about 1s). Compiled with Intel (ftn/icc) Cray XC, no debugging and run with slurm -hint=nomultithreading. If anyone could suggest what could be happening in the model at these times I would greatly appreciate it.
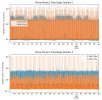
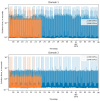
Plot showing solution time associated with time-steps coincident with micro-physics time-step intervals for each domain for run using
2,300 CPUs and 3,600 CPUS (quilting CPUs counted separately).
TL;DR
There are some really long solution times (greater than 100s) that occur at regular 5-hour intervals that don't seem to be associated with I/O and I can't figure out how—or if—I can decrease them. Throwing more CPUs has only shaved a few seconds off each time-step.
Background
I have a 20-day nested 4-km/1-km simulation for the Southeastern US and noticed that time-steps can be generally sorted into 3 categories based on the wall-time required for a solution:
- Group 1–less than 10 seconds;
- Group 2–greater than 10 seconds to 100 seconds; and
- Group 3–greater than 100 seconds.
Group 1 solution times coincide with time-steps occurring between data ingestion periods (micro-physics, radiation, etc.), Group 2 solution times are associated with time-steps that coincide with the hourly input data intervals, and Group 3 solution times occur every 5 hours on the first time-step of the hour, but the pattern resets on the following day (e.g. 1975-03-17 05:00:20, 1975-03-17 10:00:20, 1975-03-17 15:00:20, 1975-03-17 20:00:20, 1975-03-18 05:00:20, etc.). Given that I'm running this model for a total of about 45 years of simulation time in 20-day chunks, if I can save 4-6 (2-3 per domain) hours per run that would save me several weeks-worth of wall-time overall.
To this end, I had aimed some tests at scaling CPUs to try to decrease my wall-time, but have so far been largely unsuccessful in achieving appreciable reductions in the latter group associated with the 5-hourly interval which has me wondering if there is something else going on in the model at these times that is separate and apart from computations that is causing this. Some of the relevant processes in the model include nudging which occurs every 3 hours in domain 1 and not in domain 2, history output is hourly, and input interval is hourly. I/O should not be a bottleneck as I'm working with a brand new machine that has a Lustre file system (75 GB/s read and write with 12 OSTs) and quilting enabled using 120 CPUs. I've looked at the radiation scheme time-steps and these are all very short (about 1s). Compiled with Intel (ftn/icc) Cray XC, no debugging and run with slurm -hint=nomultithreading. If anyone could suggest what could be happening in the model at these times I would greatly appreciate it.

Plot showing solution time associated with time-steps coincident with micro-physics time-step intervals for each domain for run using
2,300 CPUs and 3,600 CPUS (quilting CPUs counted separately).
Attachments
Last edited:

