Scheduled Downtime
On Friday 21 April 2023 @ 5pm MT, this website will be down for maintenance and expected to return online the morning of 24 April 2023 at the latest

Orography artifacts around 0 degrees Longitude

douglowe

Member
Hi all,

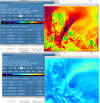
I'm interested in testing the sub-grid gravity wave (gwd_opt=1 for real/wrf) over Europe and northern Africa. Doing so requires the use of the CON, OA1-4 and OL1-4 orography variables generated by geogrid. Unfortunately I'm finding that there are some artifacts in the CON and OA1-4 fields along 0 degrees Longitude (see the right panel of the plot below for an example of this), presumably because the dataset that is being used runs from 0 to 360 degrees longitude.

My domain grid resolution is 15km, which is close to the resolution of the 10 minute orography dataset that is used by default for these variables. I've tried applying smoothing masks and different interpolation options, these don't seem to do a lot to help. The best I've found is using the 20 minute orography dataset, which does eliminate the artifacts, but that seems to give a generally higher value for CON than using the 10 minute dataset (see left panel of the plot below).

So - my questions are:
1) how important are these artifacts (can I ignore them)?
2) are there any other methods that can be suggested to address this problem?

Thanks,
Doug


&share
wrf_core = 'ARW',
max_dom = 1,
start_date = '2015-06-29_00:00:00',
end_date = '2015-06-29_18:00:00',
interval_seconds = 21600
io_form_geogrid = 2,
/

&geogrid
parent_id = 1
parent_grid_ratio = 1
i_parent_start = 1
j_parent_start = 1
e_we = 501
e_sn = 501
geog_data_res = 'default'
dx = 15000,
dy = 15000,
map_proj = 'lambert',
ref_lat = 32.0,
ref_lon = 10.0,
truelat1 = 32.0,
truelat2 = 32.0,
stand_lon = 10.0,
geog_data_path = '../geog/'
/


Screenshot 2022-07-19 at 11.31.23.png
 
Doug,
The artifacts look large, which makes me feel a little bit uneasy to ignore them. Probably you can run a quick test to check how large their impact could be?
As for the interpolation option, have you tried the option "nearest_neighbor" instead of the default option "average_4pt"?
 
Ahh - I had not tried 'nearest_neighbor', so have tried that now (see below). Unfortunately the artifacts at 0 degree longitude remain. I wonder if these are in the original datafile, rather than being created by geogrid when it processes the data. What data format are the original files, and are there any tools available for viewing / editing these?

I have run a couple of day simulation with the original input files - but haven't looked at the output yet. We'll have a look at this, and see if we can notice any obvious disturbances around these points.


Screenshot 2022-07-20 at 10.04.54.png
 
Doug,
Thanks for the update. The data is in binary format. Details of the format can be found heree:
I attached a python script to plot specific WPS "tile" data in binary format (please modify based on the CON data).
 

Attachments

  • plot_tile.py.txt
    948 bytes · Views: 4
Hi Ming,

Thanks for sharing your python script - I've used it to investigate the CON and OA1-OA4 data. It seems that the 1st column in each of these is suspect. E.g., these are the stats for CON (without applying scale_factor):
first column stats
max: 9554, mean: 76.73611111111111, min: -29455
second column stats
max: 278, mean: 8.931481481481482, min: 0
last column stats
max: 226, mean: 9.610185185185186, min: 0
For now I'm going to replace the values in the first column with those from the second column (which should be close enough for my purposes). I'll run a test case with the cleaned data, and will report back on what difference (if any) it makes.
 
Doug,
Thanks for the update. Do you mean that the 1st column of all the data files look not correct?
 
hi Ming,

The 1st column of the CON data file looks incorrect.

Looking more at the OA1-4 data, I don't think my fix above works. The OA1 field I get in the geo_em.d01.nc file is:
Screenshot 2022-08-01 at 18.22.05.png

But, the original data this is calculated from seems to be striped, and I can't simply swap out the first column of data & replace it with the second column of data.
00001-02160.00001-01080.png

I can't see any clear patterns in the first and last columns of data that distinguish them from the neighbouring columns of data. So I'm at a bit of a loss as to how I can clean the 0 degrees longitude line in my domain.
 
I have fixed the problem for OA1-OA4. What was needed was the addition of a boundary around the global dataset, so that the 4-point average could be calculated sensibly at 0 degrees longitude. See the image below for the new geo_em dataset that this produces.


Screenshot 2022-08-02 at 16.14.41.png


I've attached a copy of the (very rough 'n ready) python script I used for adding the boundary for each of the OA1-4 datasets. Not sure the boundary at the poles is sensible - but for my purposes it was sufficient. I then also edited the index file, so that 'tile_bdr' is set to a value of 3.

If a sensible boundary for the poles can be chosen, it might be worthwhile adding this change to the main dataset, so that other users don't have to apply it themselves?
 

Attachments

  • add_tile_bdr.py.txt
    1.3 KB · Views: 4
Doug,

Many thanks for the update and kind information. I will talk to our expert and see what he thinks.
 
Hello. I decided not to open a new topic and loaded this I'm writing here. I hope it's not a problem. I ran the model at high resolution (about 800m) and noticed that artifacts appear on the wind components (U; V) at different heights
 

Attachments

  • artifacts.png
    artifacts.png
    414.7 KB · Views: 2
Top