Scheduled Downtime
On Friday 21 April 2023 @ 5pm MT, this website will be down for maintenance and expected to return online the morning of 24 April 2023 at the latest

Overestimation of hurricane rainfall in WRF simulation

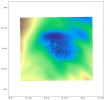
I am simulating two hurricanes that crossed Orlando, FL: Ian (2022) and Charley (2004). I attached plots of the rainfall associated with the storms. I used two separate PBL schemes for model performance (MYJ and YSU). The plots are an average of five simulations; for example, Ian's rainfall time was from 28_00 to 30_00, so the simulations started from 27_00, 27_06, 27_12, 27_18, and 28_00. I attached the namelist files for Ian. Now the problem I am facing is that Ian's simulations are producing almost 300% more rain than the observation (AORC precipitation data). I guess this is not normal.

What do I need to change to fix this? Any help would be appreciated.


Thanks!
 

Attachments

  • florida_stroms.png
    3.2 MB · Views: 8
  • namelist_ian.wps.txt
    971 bytes · Views: 4
  • namelist_ian_myj.input.txt
    4.1 KB · Views: 6
  • namelist_ian_ysu.input.txt
    4.1 KB · Views: 4
It seems that precipitation is overstated for Ian but underestimated for Charley, is this correct?

Can you try the options below:
mp_physics = 8, 8, 8,
ra_lw_physics = 4, 4, 4,
ra_sw_physics = 4, 4,4,
cu_physics = 16, 0, 0
radt = 12, 12, 12
Hope this can give you better results.
 
It seems that precipitation is overstated for Ian but underestimated for Charley, is this correct?

Can you try the options below:
mp_physics = 8, 8, 8,
ra_lw_physics = 4, 4, 4,
ra_sw_physics = 4, 4,4,
cu_physics = 16, 0, 0
radt = 12, 12, 12
Hope this can give you better results.


Hello Ming,

Thanks for your reply. I followed your suggestion along with some other changes: I added nudging and increased the spin-up period for each simulation. Now, the simulations started at 26_12, 26_18, 27_00, 27_06, and 27_12 for Ian. The same changes are made for Charley too. The results are definitely much better than the previous, and visually, the YSU scheme performed better for both storms. I also added plots for hourly rain rate for both schemes, comparing with the observation (florida_hourly_rainfall.png). The rain amounts considered in the plots are the average of five simulations over this spatial extent (boundary.png).

Do you think I can accept these results? or do I need to do more trials?


Thanks!
 

Attachments

  • boundary.png
    boundary.png
    78.9 KB · Views: 5
  • florida_hourly_rainfall.png
    1.7 MB · Views: 8
  • florida_ysu_myj_rain.png
    2.9 MB · Views: 2
  • namelist_input_YSU_ian.txt
    4.8 KB · Views: 3
It seems that precipitation is overstated for Ian but underestimated for Charley, is this correct?

Can you try the options below:
mp_physics = 8, 8, 8,
ra_lw_physics = 4, 4, 4,
ra_sw_physics = 4, 4,4,
cu_physics = 16, 0, 0
radt = 12, 12, 12
Hope this can give you better results.

Hi Ming Chen, I am still waiting for your response. Can you please look into the previous (July 11) post?

In addition, I want to be sure I am using the correct options as I am using V-3.9.1.1:

mp_physics = 8, 8, 8, (Thompson scheme)

ra_lw_physics = 4, 4, 4, (RRTMG scheme)

ra_sw_physics = 4, 4,4, (RRTMG scheme)

cu_physics = 16, 0, 0 (New Tiedtke scheme)

radt = 12, 12, 12 (for a 12 km parent domain)
 
I am sorry to answer late. We have multiple projects going on simultaneously while my colleague is on vacation.
The results look fine to me. And the options you listed in your post of July 31 are appropriate options for hurricane simulation.
 
Top