Hi everyone,
I noticed some strange pressure oscillations in my test simulations. Is it a known issue or is there a namelist option I chose wrong ?
Description of my simulation test :
- 1 domain
- DX=DY=9.477 km, NX=NY=121, NZ=52, DT=60s, DT_acoustic=20s
- PBL=MYJ, land_surface=NoahLSM, LW=RW=RRTMG,
- forced by ERA5, 1hourly
- More details in the namelist linked
Description of the analysis
- I first plotted the pressure over time interpolated to a given height (200m, 1500m, 10000m, 17000m) at a location in the middle of my domain where I output a time series. The figures 01_PXXXX shows this evolution for the time series output (blue) and the 10min averaged computed (black). One can see some oscillations with a period of about 1h30min
- I then computed a 1st order derivative with the 10-min time-averaged surface pressure (PSFC). I used several points on a cross-coast line that covers approximately 1/4th of the domain. The first derivative is plotted in 02_dPdt. The higher frequency oscillation (about 1h30) becomes more evident in the derivative plot. Note for all location, the oscillation is in phase
- I plotted the time autocorrelation of the dPdt signal to better measure the oscillation period (03_autocorrelation_dPdt)
Sensitivity
- I ran 4 more simulations :
-- blue : reference (domain length = 1.1 E6 m)
-- orange : NX=200 (domain length = 1.9 E6 m)
-- green : DX=5km (domain length = 0.6 E6 m)
-- red : DT=20s, DT_acoustic=5s (domain length = 1.1 E6 m)
-- purple : DX=3.159km, NX=361, DT=20s, DT_acoustic=20/3s (domain length = 1.1 E6 m)
- The autocorrelation plot is attached in figure 04_comparison_autocorrelation_dPdt. It shows that the frequency is modified for orange and green curves but is constant for the three other simulations where the domain length remains the same as the reference.
- I plotted the fft of the autocorrelation for these 5 simulations (05_fft_autocorr_dPdt) and then normalized the frequency with the domain length and the sound velocity (05_fft_normalized_pulsation). The position of the main peak collapses for all curves.
Conclusion
- The oscillation seems to be related to a sound wave oscillation through the whole domain. The normalized pulsation is on the order of 10^0 which means that the period is near the time needed for a sound wave to travel through the domain.
Attachments
-
namelist_14_04.input6.9 KB · Views: 0
-
 01_P200.png40.2 KB · Views: 4
 -
 01_P1500.png37.6 KB · Views: 4
 -
 01_P10000.png32.4 KB · Views: 6
 -
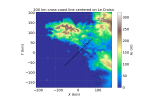 02_crosscoast_line.png72 KB · Views: 5
 -
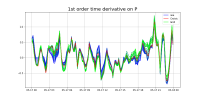 02_dPdt.png95.5 KB · Views: 6
 -
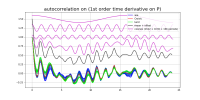 03_autocorrelation_dPdt.png117.4 KB · Views: 6
 -
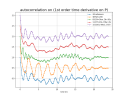 04_comparison_autocorrelation_dPdt.png80.7 KB · Views: 6
 -
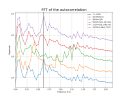 05_fft_autocorr_dPdt.png86.1 KB · Views: 6
 -
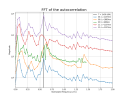 05_fft_normalized_pulsation.png82.7 KB · Views: 3
Last edited:
