svangorder
New member
Hi
I'm having a problem with geogrid processing of the high resolution Mandatory Static Data (geog_high_res_mandatory.tar.gz) which I downloaded from http://www2.mmm.ucar.edu/wrf/users/download/get_sources_wps_geog.html#mandatory.
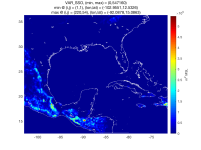
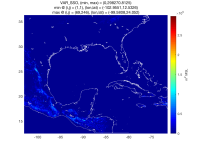
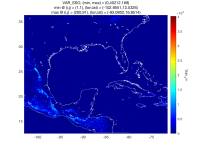
My nominal grid resolution is 5km over the area 103W - 71.4W and 13N - 37N so 2min data should be adequate for interpolation to my grid. For most fields, only the default resolution is included in the data set and it is the highest resolution described in GEOGRID.TBL.ARW; typically 30sec. But for two fields, VAR_SSO and LAI12M, the default resolution is 10min even though higher resolutions are provided. The LAI12M 10min and 30sec look quite similar, but the different resolution VAR_SSO data are vastly different. Their magnitude varies by more than an order of magnitude. Here is a table and there are plots below. Note the different scaling in each plot.
10m resolution range: 0 - 547160 , mean: 6950
2m resolution range: 0 - 298270 , mean: 1555
30s resolution range: 0 - 40212 , mean: 306
Does anyone know why the different VAR_SSO data should be so different? I'm very confused about which resolution data to choose. I'm new to WRF and its many inputs so I don't have a good feel for what are reasonable values of VAR_SSO. I'm uncomfortable with blindly using the default data.
Any insights would be greatly appreciated,
Steve


