Scheduled Downtime
On Friday 21 April 2023 @ 5pm MT, this website will be down for maintenance and expected to return online the morning of 24 April 2023 at the latest

scale_region strange behavior

phillipyeh

New member
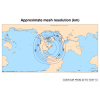
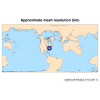
I started with the 92-25 km circular mesh, centered the higher resolution portion over the Northeast US (40N, 73W), cut out a circular region with radius 17000 km, and then used the scale_region.py tool to scale it down by a factor of 8.

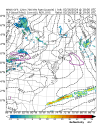
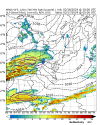
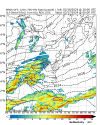
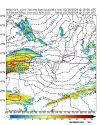
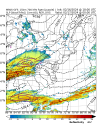
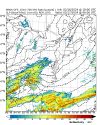
I then ran a 24-hour simulation starting 18UTC on 16 Feb 2024. I was able to successfully generate output files, with no error messages in the log files. However, when I look at the output, it does not match the observed output at all. In particular, over the Eastern US, the precipitation is in the wrong location, and the pressure/height fields do not match observations.

I checked the land-ocean mask in the history* files, and the mask is in the correct place. So the issue does not appear to be with the grid.nc or static.nc files.

The grid files and output are located in this cloud directory:

Let me know if you need anything else. Thanks!
 
Could you post a plot or two here to give an idea of how badly the simulation results are mismatched with observations? Certainly, the simulation results will not be a perfect replication of reality, so some mismatch in the location of precipitation, and some disagreement in the pressure and height fields is probably not unexpected.

The scale_region.py tool uses a stereographic projection to map the regional mesh from the sphere to a plane, where it is scaled by the prescribed factor. With a radius of 17000 km, the unscaled regional domain would cover more than a hemisphere of the globe, and perhaps the large map scale factors in the projection of that regional domain onto a plane are leading to issues: when scaling the mesh on the plane, cells in the mesh are translated between regions of different map scale factor, leading to differences in the scaled cell areas from what one would expect based on an application of the nominal scaling factor.
 
Attached are SLP + radar composites at 18UTC (19UTC in MPAS) on 16 Feb, 00UTC on 17 Feb, and 06UTC on 17 Feb. While the fields at 19UTC still look somewhat close to the WPC analysis, by 06UTC the model has diverged significantly from the WPC.

If the larger-than-hemisphere unscaled domain leads to large map scale factor issues, is there another way to generate a mesh of this size that scales down from ~12km to ~3km?
 

Attachments

  • radsfcus_exp2024021618.gif
    radsfcus_exp2024021618.gif
    32.4 KB · Views: 10
  • radsfcus_exp2024021700.gif
    radsfcus_exp2024021700.gif
    34.9 KB · Views: 8
  • radsfcus_exp2024021706.gif
    radsfcus_exp2024021706.gif
    34.2 KB · Views: 9
  • ReflFgenAt700mb_GFS_12km.Thompson_init-20240216_1900.png
    ReflFgenAt700mb_GFS_12km.Thompson_init-20240216_1900.png
    437.3 KB · Views: 9
  • ReflFgenAt700mb_GFS_12km.Thompson_init-20240217_0000.png
    ReflFgenAt700mb_GFS_12km.Thompson_init-20240217_0000.png
    478.8 KB · Views: 10
  • ReflFgenAt700mb_GFS_12km.Thompson_init-20240217_0600.png
    ReflFgenAt700mb_GFS_12km.Thompson_init-20240217_0600.png
    483.5 KB · Views: 13
I wanted to follow up on whether there are any recommendations on what to try next. For the server that I have access to, a grid.nc file ~350 MB or less is manageable, but anything larger likely will not run. I would preferably like a mesh that starts with ~12-15 km grid spacing on the outside and then reduces down to ~3 km. The outer extent would ideally at least cover North America, similar to what I have tried here.
 
Hi,

Thank you for uploading the files for this case.

We will look into this case and get back to you once we know for sure what is going on.

It may take some time. Thank you for your patience.
 
Hi,

I looked at the data you uploaded ( static, initial, history and diag files),all of which show a fundamental coordinate error. For example, the latitude and longitude ranges of your domain are (-28.131401, 89.34316) and (-250.7447, 105.82152), respectively. This may explain why the latitude shown in your plots ( #4 - #6 ) is not correct.

I don't have your grid file produced by scale_region.py. We need to double check that file and make sure it is created correctly. Please upload it for me to take a look.

Also, can you clarify how you create the fine mesh step by step? I am suspicious that something is wrong during this process. Thanks.
 
I have now added the grid file to the same Box directory. Let me know if can be accessed or not.

As for the steps I used to make this mesh:
(1) Downloaded the 92-25 km circular mesh
(2) Used the grid_rotate utility to center the higher resolution portion over the Northeast US (40N, 73W)
(3) Used the create_region python tool to cut out a circular region with radius 17000 km, with the same 40N, 73W center. I believe this step is the one that generates the new graph.info files.
(4) used the scale_region.py tool to scale it down by a factor of 8.
 
Whoops, I forgot to put that, it's Northeast_region_variable_3km.grid

The file is in this Box directory, does that link still work for you?
 
I looked at your grid data file (Northeast_region_variable_3km.grid). Please see the plot below. Is this the area covered by the fine mesh created by scale_region.py? If so, it is way too large.


Image


Please send me your grid files and plots for

(1) the MPAS mesh after you run grid_rotate,

(2) the mesh after you run create_region

I guess we need to start from the beginning to recreate the 3km mesh.
 
The plot you made is the area covered by the fine mesh. I am fine with trimming down the edges, but I would like the mesh to at least fully cover the CONUS on the western edge.

The grid files in the same Box link are:
(1) x4.163842.NEUS_25km.grid.nc
(2) Northeast_region_25km.grid.nc
(3) Northeast_region_variable_3km.grid.nc

I have also attached the mesh resolution plots for (1) and (3). Let me know if you need anything else.
 

Attachments

  • mesh_resolution_grid_rotate.png
    mesh_resolution_grid_rotate.png
    168.7 KB · Views: 4
  • mesh_resolution_scale_region.png
    mesh_resolution_scale_region.png
    132.5 KB · Views: 4
The area shown in your right panel is a little small. This is just my personal opinion. There is no rule to determine how large a regional domain should be. So you can choose whatever you want for your study.

Please start from the beginning and make sure all steps are done correctly. Keep me updated about the new simulations. Hope the results can be better.
 
It comes down to the computational power of the server I have access to, which limits how large I can make the size of the 3-km region. Ideally, I would like a mesh that starts out near 12-15km on the outer edge of the domain, then reduces to ~3km within the Northeast U.S.

Do the other grid files (x4.163842.NEUS_25km.grid.nc and Northeast_region_25km.grid.nc) look ok, or does it look like there may be problems with those files?
 
They look fine to me. However, if you go to MPAS home, you can find various meshes available for download. The 60-15km mesh can be scaled to 12-3km, which probably is better for your case.
 
Going back to post #7, do the steps look right? I know that in post #6, you mentioned there was a fundamental coordinate error. However, I don't know what caused that error, and what can be done to fix it - especially if the other grid files all look ok?
 
I am not sure what caused the errors in coordinate. I have never seen such kind of errors before. Due to limited resources we have, it is hard for us to repeat exactly what you did and track possible reasons for the errors.

Meanwhile, all the codes and utilities used in the mesh creation process are well tested and we know for sure they work as expected. This why I suggest that you follow the instructions to re-do everything from the right beginning.
 
Top