catalinaporaicu
New member
Hello,
I am trying to run WRF-Chem with MOZART MOSAIC for Reunion Island, off the coast of Madagascar. I am using WRF-Chem V4.1.2 with KPP.
I am using CAMS and CAM-Chem for the initial and boundary conditions, which look okay. However, some species (namely CO) has a very strange distribution in the output, where it looks like a numerical error that occured between the start of the run.
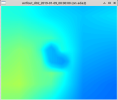
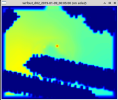
I attached the output of CO at the surface for the initial condition, and then for 5 minutes later. This is occuring in the d02 domain, however this of course impacts the parent domain. The strange distribution after 5 minutes occurs over the entire vertical grid, not just at the surface. This shape shows up in other species too, but CO is the most obvious one with the most distinct shape.
It is as if there is an "overlay" of some sort over the correct values (which is the green in the second picture, corresponding to realistic CO output values). However, the dark blue is very, very low and it has a very strange, jagged distribution with distinct changes at the edges.
I checked my emission input files for the run and they do not contain any NaNs or negative values that might cause this strange numerical error. I already tried to do a test run where I turned off chemical emissions and kept it to chemistry based on the boundary and initial conditions, which still showed the same shape.
What might this be caused by? Please, any help would be greatly appreciated. I am happy to give more information that could help elucidate this problem.
I am trying to run WRF-Chem with MOZART MOSAIC for Reunion Island, off the coast of Madagascar. I am using WRF-Chem V4.1.2 with KPP.
I am using CAMS and CAM-Chem for the initial and boundary conditions, which look okay. However, some species (namely CO) has a very strange distribution in the output, where it looks like a numerical error that occured between the start of the run.
I attached the output of CO at the surface for the initial condition, and then for 5 minutes later. This is occuring in the d02 domain, however this of course impacts the parent domain. The strange distribution after 5 minutes occurs over the entire vertical grid, not just at the surface. This shape shows up in other species too, but CO is the most obvious one with the most distinct shape.
It is as if there is an "overlay" of some sort over the correct values (which is the green in the second picture, corresponding to realistic CO output values). However, the dark blue is very, very low and it has a very strange, jagged distribution with distinct changes at the edges.
I checked my emission input files for the run and they do not contain any NaNs or negative values that might cause this strange numerical error. I already tried to do a test run where I turned off chemical emissions and kept it to chemistry based on the boundary and initial conditions, which still showed the same shape.
What might this be caused by? Please, any help would be greatly appreciated. I am happy to give more information that could help elucidate this problem.