Hi,
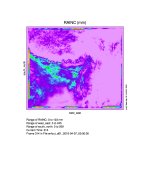
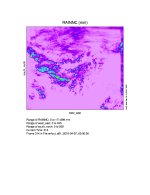
I am using ndown to generate boundary conditions for an inner domain. The wrf output of this inner domain however contains narrow bands of strange values at the boundaries. I have given the output of rain variables, but holds true for T2 variable as well. The distinctiveness of the bands increases with the model output time. I am using WRF-4.1.3.
Kindly help in resolving this issue.